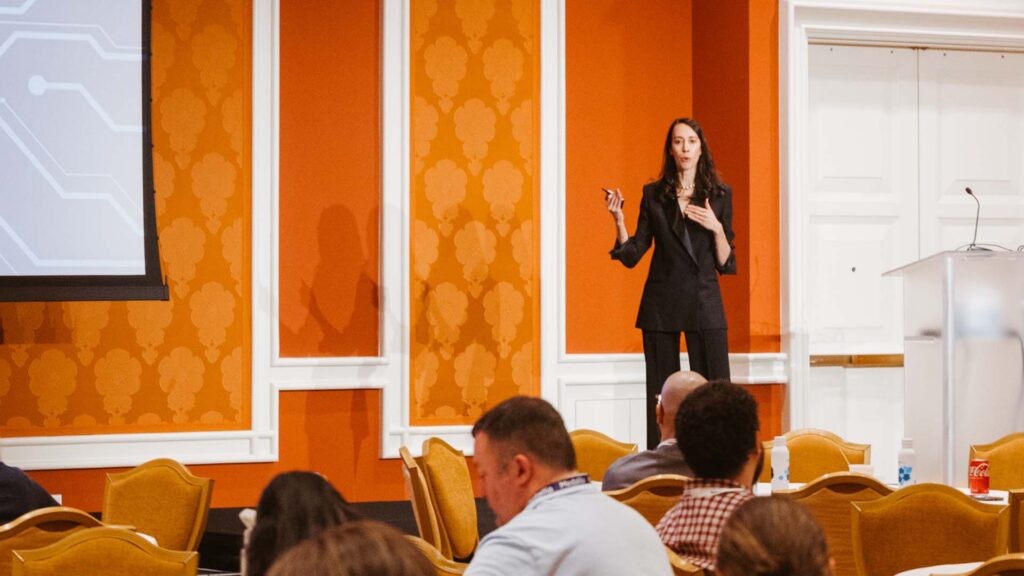
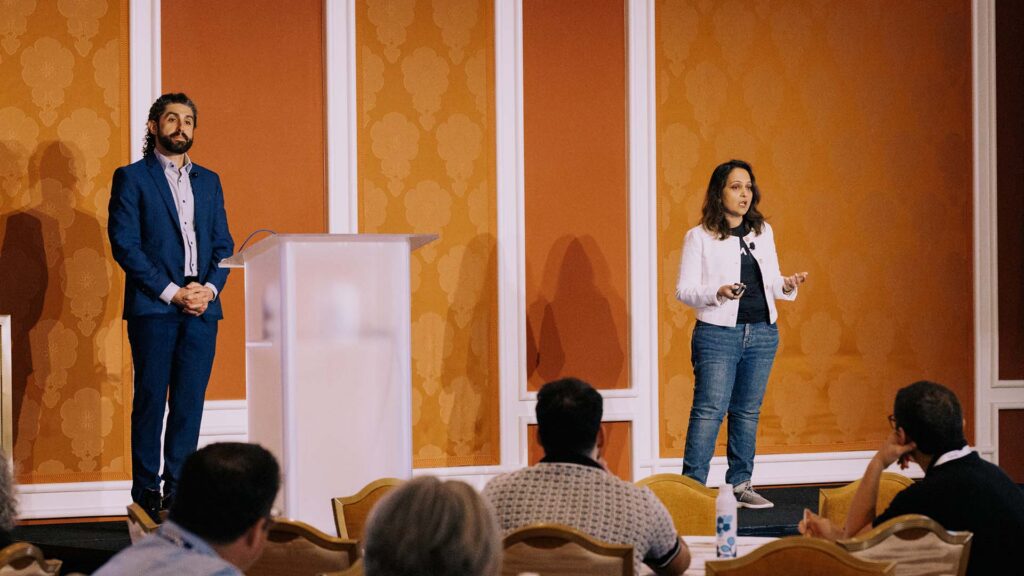
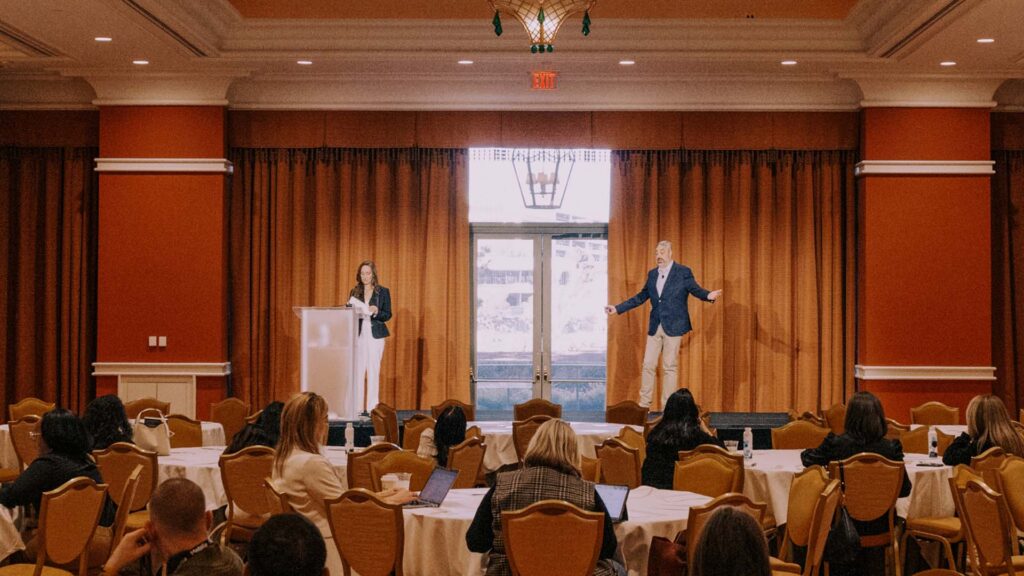
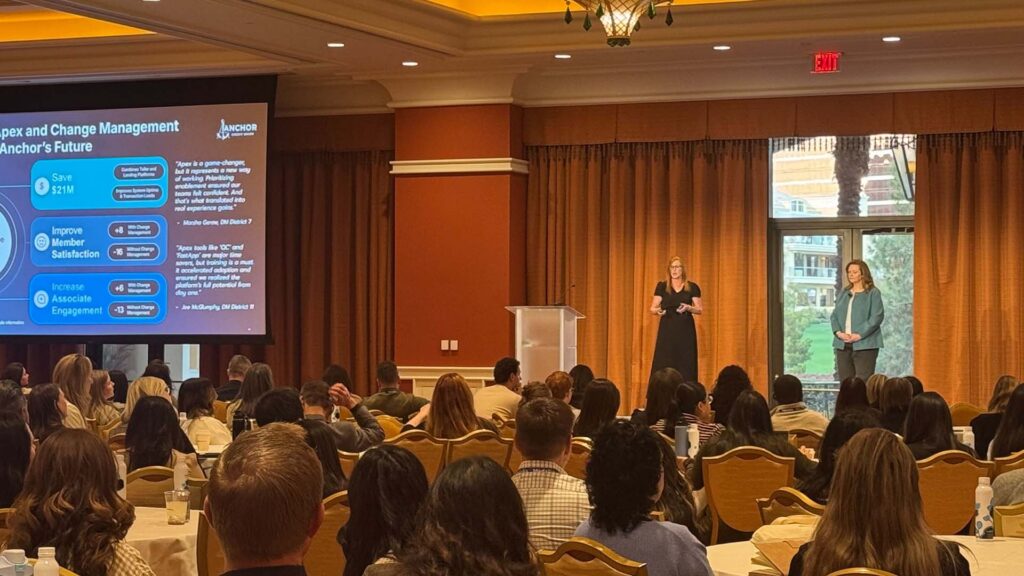
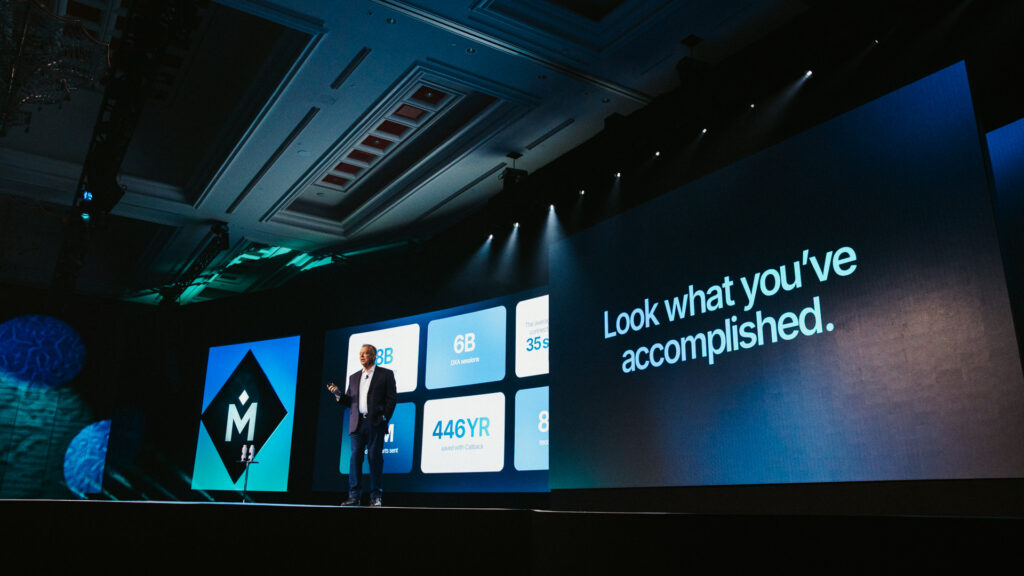
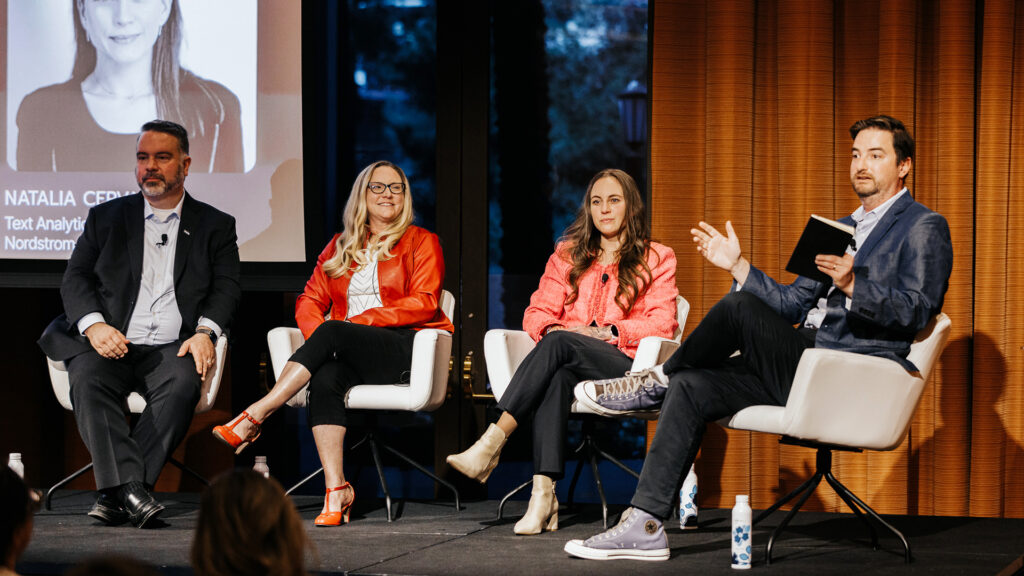
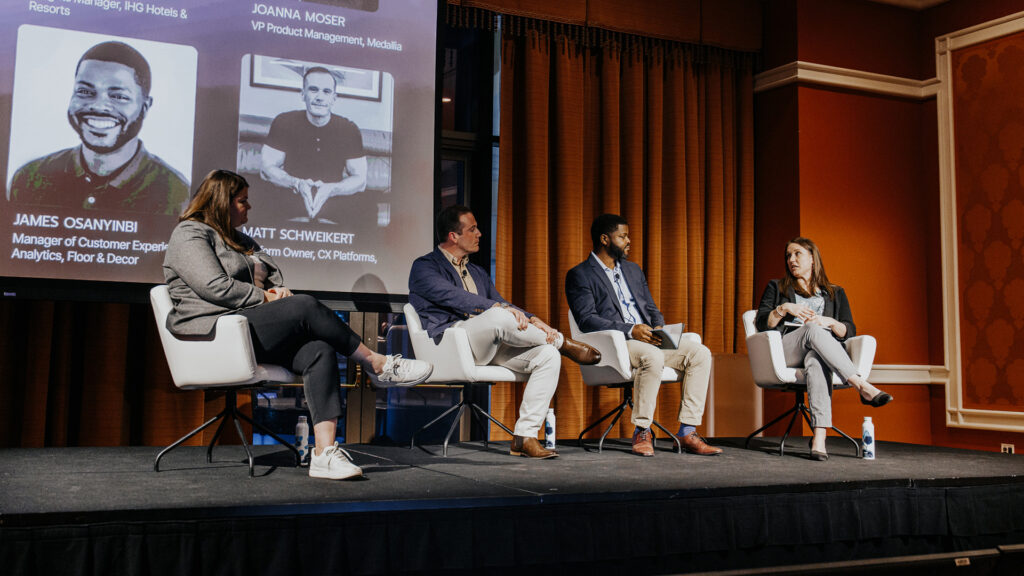
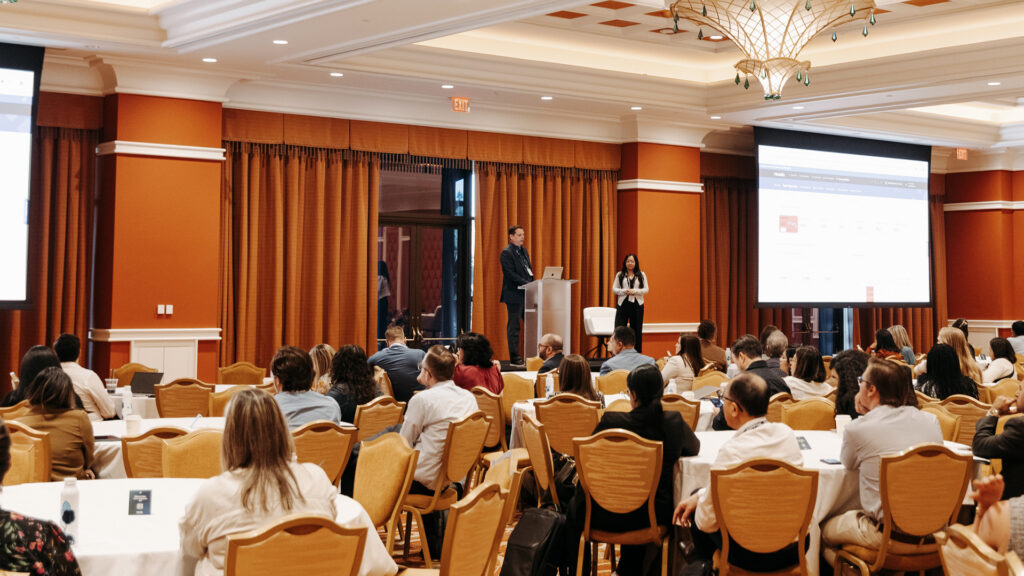
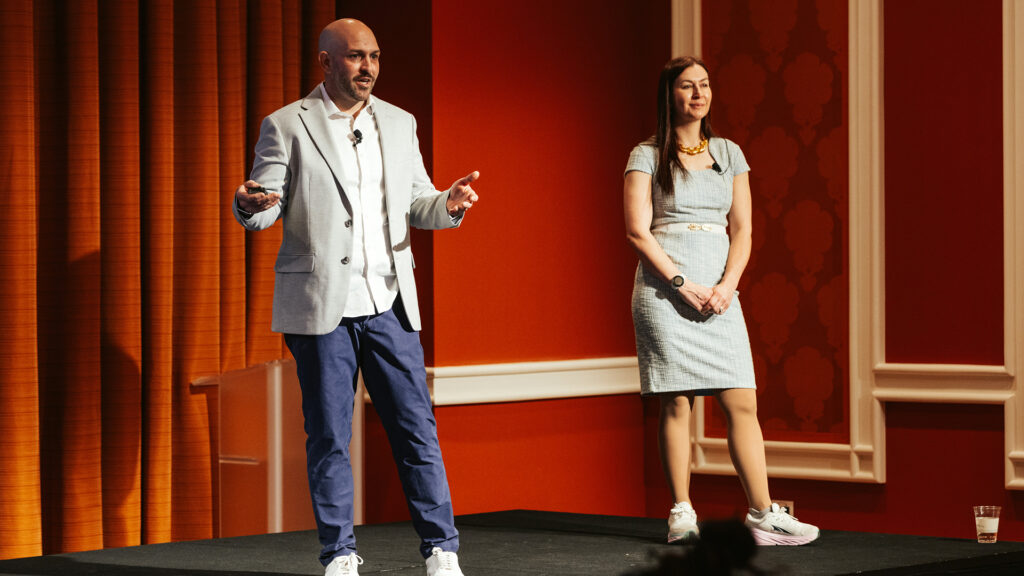
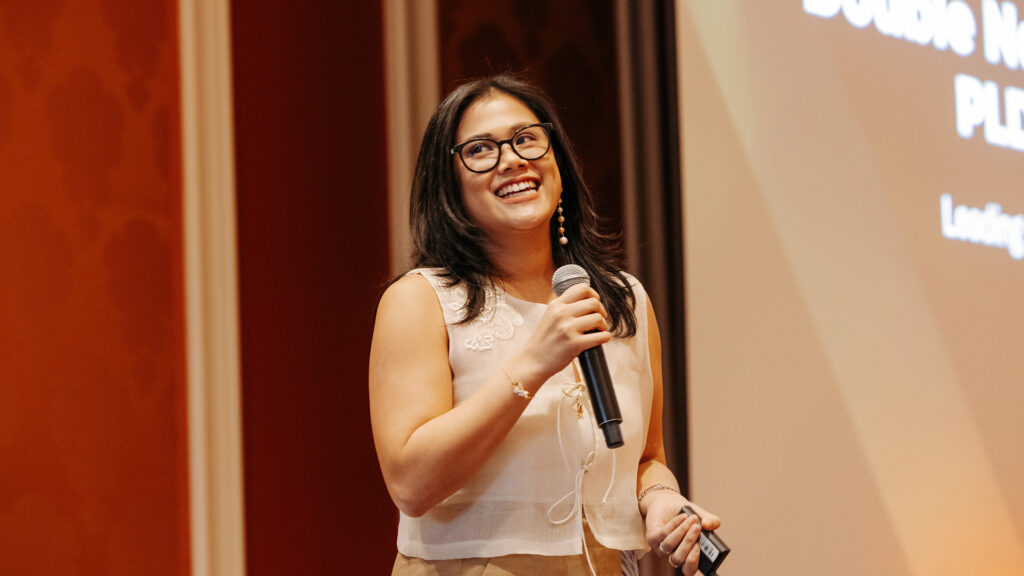
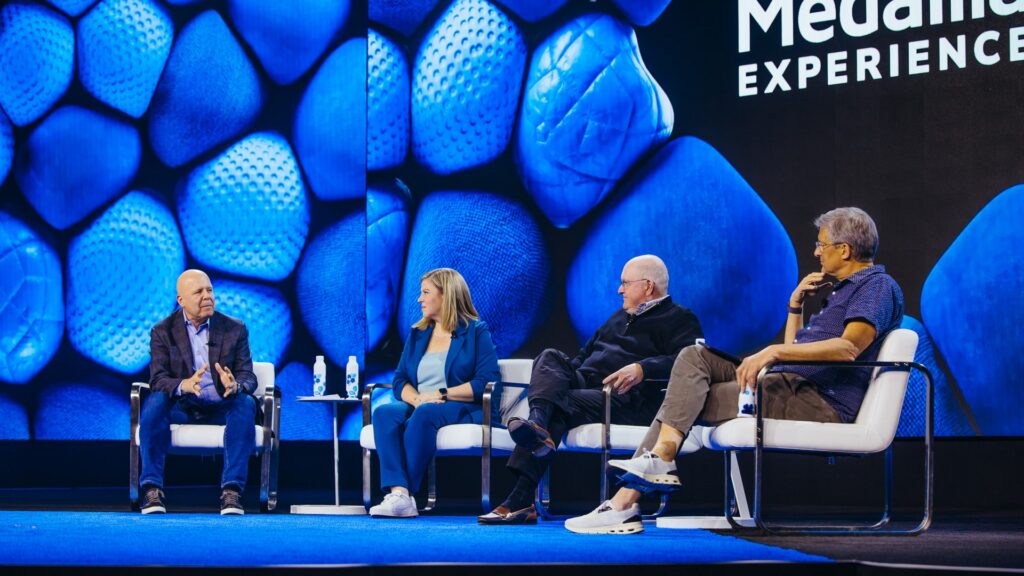
Joanna Moser: [00:00:00] My name is Joanna Moser. I’m a Vice President of Product Management here at Medallia, and I’m so fortunate to be joined by this accomplished and dynamic panel to talk about text analytics. So this is just the means through which we derive organization and action from all of the unstructured data that comes in from your customers and employees.
And we’re really gonna spend the next 45 minutes talking about how. Text analytics or TA as we might mention it is really an integral part of an enterprise experience program. So I’m gonna have our panel go through and introduce themselves and if you guys could share a little bit about yourself about your program and kind of who owns
Shira Whatley: it within the organization.
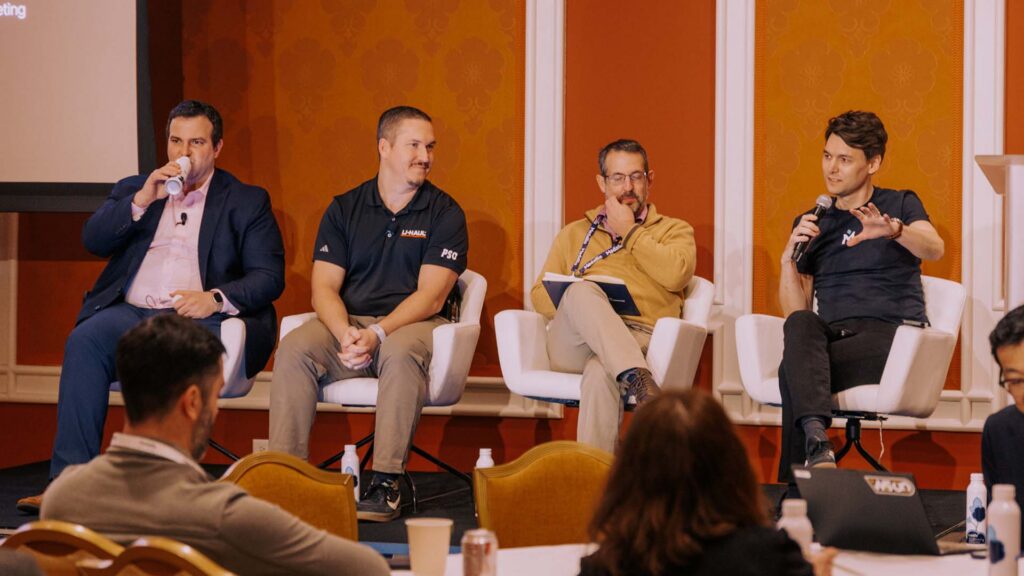
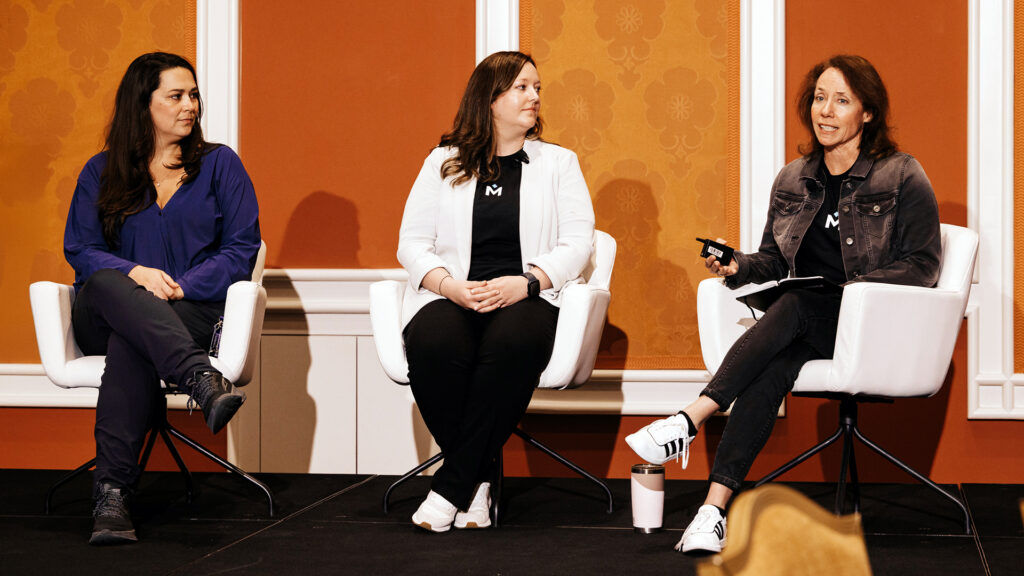
Hi everyone. I am Shira Whatley and I work at IHG Hotels and Resorts. And we have 20 brands and over 6,000 properties worldwide. And so we have over 4 million survey returns. Each year. So we do have a lot of feedback in that sense. We’ve worked with Medallia for over 10 years and they gather all of our post-day feedback surveys along with [00:01:00] our IHG online guest reviews and our social feedback from google.com booking and all of that.
Our primary metric for success would be our overall satisfaction score, which we actually call our guest Love Score. And so we look at that at a top three bots. In addition to that, we also look at some of our key driver metrics within the survey, so things like our overall satisfaction with arrival service room and f and b.
And our team actually owns the program and, in charge of all of the hierarchy with the survey and all of the native reporting and things like that, and really seen as the subject matter experts of the Medallia program.
Joanna Moser: Yeah, it’ll be interesting. I’ll come back to you in a minute to talk about managing, having kPIs across the customer journey. Yeah. When it comes to doing these analyses. James, let’s go to you.
James Osanyinbi: Hello everyone. I’m James of Soy Bee Manager of CX Analytics at Floor and Decor. We’re a specialty retail flooring company. We have about 250 stores in the [00:02:00] United States, and we specialize, like I said, in hard surface flooring.
Our program is really divided between digital and retail for our stores, and we’ve been with Medallion for about three years on the store retail side. And then for the digital program, we’ve been with them for about five years. We focus primarily on NPS. Our net promoter score is very important to us.
We’re a project based company, so you coming in to either renovate your home or you may be a contractor who’s doing work for several other clients. So we really pride ourselves on the customer engagement experience. We also look at things like being greeted, being assisted, recommending installation materials for you, and are we asking the right project questions?
So those are some of the key drivers that we have along with NPS and we’re really focused on our measures of success. Looking at it very holistically from the moment the customer enters the door, how are we greeting them, how are we assisting them, and what’s their overall experience with our brand?
Joanna Moser: Love it. That’s great. And Matt, we’ll go to you.
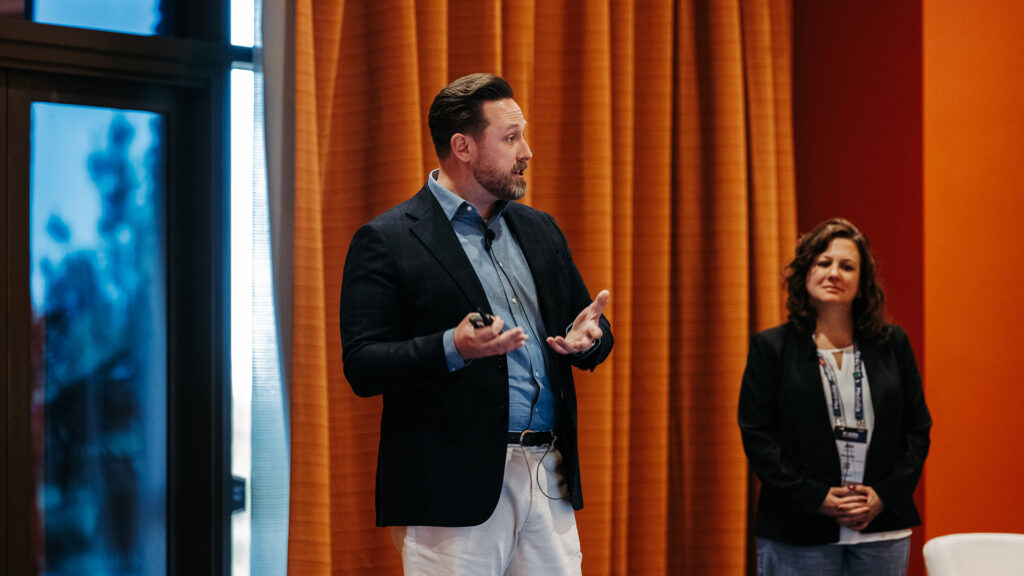
Matt Schweikert: Hi everybody. Matt Schweikert. I am the enterprise experience platform owner at MetLife. When I tell people that I work for Met [00:03:00] MetLife, most of them follow it up by asking me if I can get Taylor Swift tickets at MetLife Stadium. I’m gonna save everybody a little bit of time and tell you no, but maybe next year I’m in a unique position in the sense that I don’t actually own a program.
I. I sit within global marketing and communications and I consult with advise and ultimately empower our VOC program leads across the entire enterprise. So the cool thing about this gig is I get to work with programs that are literally just starting out and they’re infantile stages and programs that have, matured over a three to five year time span.
So a nice healthy balance of programs there. We historically have been. Pretty focused on net promoter score, both at the transactional and the relationship level. We are starting to branch out, build in things like csat, oat customer effort score, and then focusing a lot on digital health. So bringing the XA into the equation and trying to build that digital experience score into a lot of our [00:04:00] success metrics as well
Joanna Moser: with so many different stakeholders across the business.
Yeah. How do you help guide those stakeholders to the right. Metrics to use the right elements of text analytics to use when you are helping answer questions and dig into different use cases.
Matt Schweikert: So not taking a one size fits all approach certainly helps. And then basically interrogating the stakeholders for hours and hours on end, trying to learn as much about their line of business their goals.
What are you looking to get out of your program? Please don’t come to me with the everybody has a survey, so we have to as well answer. What kind of insights you’re trying to gleam? Are you bringing a hypothesis to the table that you’re trying to challenge or validate? And then, ultimately tailoring the approach to that particular line of business.
I’m also a huge proponent of the crawl, walk, run approach. I love connecting. The green program leads with the more mature program [00:05:00] leads to share best practices, dos and don’ts. And I’ve been trying to foster a lot of that cross-functional harmony since I stepped into this role.
It’s going pretty well.
Joanna Moser: Can you share a little bit more about the kind of. Crawl, walk one, run different levels of maturity from a text analytics perspective?
Matt Schweikert: Yeah, certainly. So like I, I’ve had program leads or lines of business come to the table and, wanting to launch six or seven different surveys at once, and they’re brand new to VOC and they’re brand new to Medallia.
Maybe that’s not the best approach right out of the gate. Maybe let’s pick the, most high impact, touchpoint and focus on that for now, just to get a feel for, the volume of feedback that we’re gonna come in. Obviously volume, a huge dependency in the text analytics realm.
You need a healthy amount of volume to really reap the benefits of ta. I will also say, and I’m staring at a former partner in crime of mine, Darren Hoffman. We launched the VOC program at Coldwell Banker, so we know what it’s like to have little to no [00:06:00] volume. Starting out. Spend time with your responses, go through your responses at an individual level.
I, for me, I think it’s the least you can do. This is a customer that’s taken time outta their day to share something with you. So you know, what does it take all of 10 or 20 seconds to look at it? The response at an individual level. So even if you’re not able to reap the true benefits of ta, go through each response and you will find nuggets of gold, I promise you.
Joanna Moser: Oh, that’s great. Getting to know your customer through their voice and through reading that, that feedback. So Shira, I wanted to go back to you for a second talking about having those different. KPIs and organization of your text analytics against the customer journey. Can you share a bit with that about how you help stakeholders identify the right thing to focus on?
Shira Whatley: Yeah, so a lot of it you just have to try to see like where the scores are the lowest. ’cause that’s like where you need to focus and making sure that volume’s there as well. Of course. And when we’re looking at that, making sure that when you’re trending the data, you’re specifically looking at the year over year trends.
Because [00:07:00] within the hospitality industry, seasonality is a big thing and you can, wrongly predict things if you’re just looking at it on a month to month basis. And so really we use that in conjunction with our text analytics. So our text analytics hierarchy follows our questions within the survey.
And so if you use the scores to try to find that area to focus on, then you can use the text analytics to really dig down and try to see where those. Specific problems are, and you just use that as like a piece of the puzzle to try to figure out what you need to improve.
Joanna Moser: And James, when we were preparing for this, you mentioned a wonderful problem that you have, which is that you have these nice high net promoter scores and talking about.
Using other types of metrics like sentiment to help drive the analysis when you have scores that are very high or per perhaps even scores that don’t change that much over time. Can you share a little bit more about that?
James Osanyinbi: Yes, of course. And I wanted to mention that our program sits under operations, so a lot of things that we’re working on.
We’re [00:08:00] really driving action for projects that are happening in the stores. So for us, our net promoter score is really healthy. So what I wanted to focus on with the reporting is focusing on net sentiment score. And the way I explained it to our stakeholders is that it operates similar to NPS. It’s a 201 point scale.
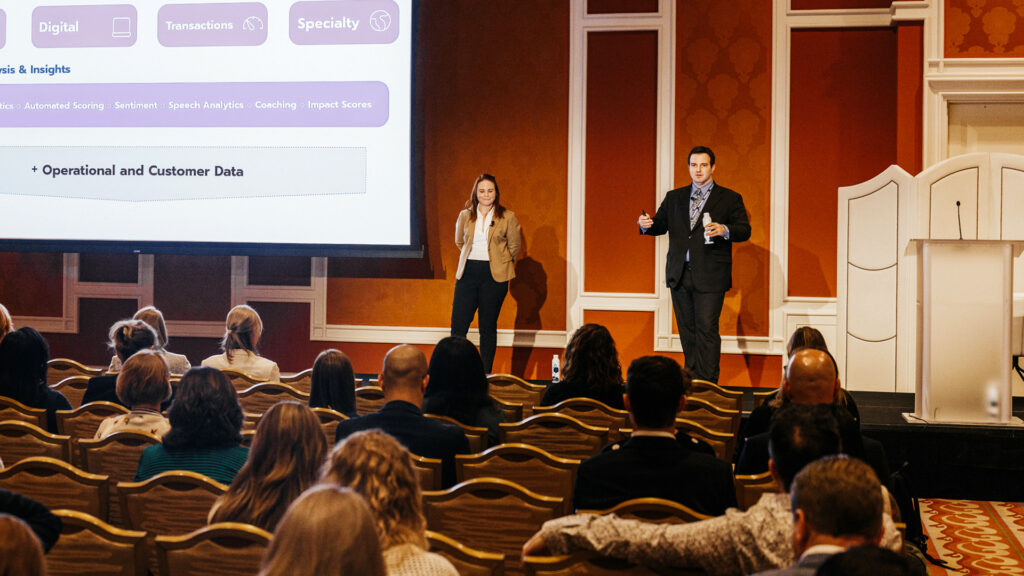
If all the customers have negative feedback about a particular topic, then the score is negative 100. If everyone’s satisfied, it’s a hundred and then it’s 50. You feel like, you’re somewhere in the middle. We focus on net sentiment score, but what we really do is behind the scenes, I’m using impact score to identify where the top and bottom topics based on that impact score.
So that helps us with understanding that there’s enough frequency of comments and also understanding the intensity of the emotion, whether it be positive or negative, but I’m showing that sentiment so that they know, as Shira said over time, how we’re improving. So for all the customers as well, because it’s really important because.
In the beginning, we wanted to focus only on detractors, but we said we need to pull back because you can have a particular topic like delivery, for instance, and you can have [00:09:00] promoters who have friction points with that. If your segment is the only two detractors, you’re not capturing that. So instead of using like a web NPS or topic NPS.
We’re using that net sentiment score and we’re tracking it month to month, and we’re also looking at year over year to enable people to understand like even if it’s scored very high, you can still have this room to grow. And even if it’s a negative topic, something that’s a friction point, it may never be positive, but what we’re looking for is gains year over year.
We’re looking for that improvement.
Joanna Moser: Yeah, I really like that, looking at change instead of static metrics. Yeah. And I’m looking at that. Did you have something to
Matt Schweikert: Oh, no, I’m agreeing. Yeah. I love it.
Joanna Moser: Excellent. And so James, you had mentioned the impact calculation as well, just for folks just for quick awareness, that’s a prior prioritization metric.
That looks at kind of volume and the way that the score looks at to identify for a given element of text analytics, how much is it pulling down or pushing up your overall metric? And so what I’d like to do is talk [00:10:00] about socialization, so how we get this information out into the business.
So Matt, I’m gonna start with you. Yeah. Can you talk a bit about how you share information out and also how you make it meaningful to individual stakeholders?
Matt Schweikert: Yeah. So we are democratizing a ton of CX VOC and Medallia related data via. Enterprise dashboards, making sure that we’re bringing both those top level metrics into dashboards, but also comments, right?
And, impact scores and things like that. I’m trying to encourage everyone within the organization to hound me about Medallia access. Again, going back to, spending time, getting to know your customers. We we’ve made a lot of strides in role-based access folks don’t have to sort through a bunch of noise to get to what’s relevant to them.
And trying to just make it as easy as possible to digest the data that’s relevant to them. I do, even though I don’t own a program, we have taken an agile approach to marketing over the last two years, so we’ve [00:11:00] got about a dozen or so agile marketing pods. Within our marketing organization, have very specific high impact goals that align with our lines of business.
So I do often support those pods in a, customer insights capacity, where they’ll come to me with a hypothesis and then I get to totally geek out and dive into Medallia and pull a ton of, relevant data. I like to start at a high level, so think top level metrics like an NPS or a CSAT or oat, and then I start to go down my little.
Customer data funnel. I use impact scores. I look at things like net sentiment. It’s incredibly impactful when you can come to a stakeholder and say, out of this pool of 5,000 responses, I. 75%, are negative pertaining to this topic.
Yeah.
Matt Schweikert: And really serves as that spark to get folks interested in digging more.
And then I still, I just love cherry picking verbatims and putting them in front of stakeholders and leaders. The literal voice of the customer, as I [00:12:00] like to say. It’s incredibly powerful and it seems to be working for us.
Joanna Moser: That’s great. Any recommendations for presentation or things that work in addition to kind of cherry picking those relevant verbatims?
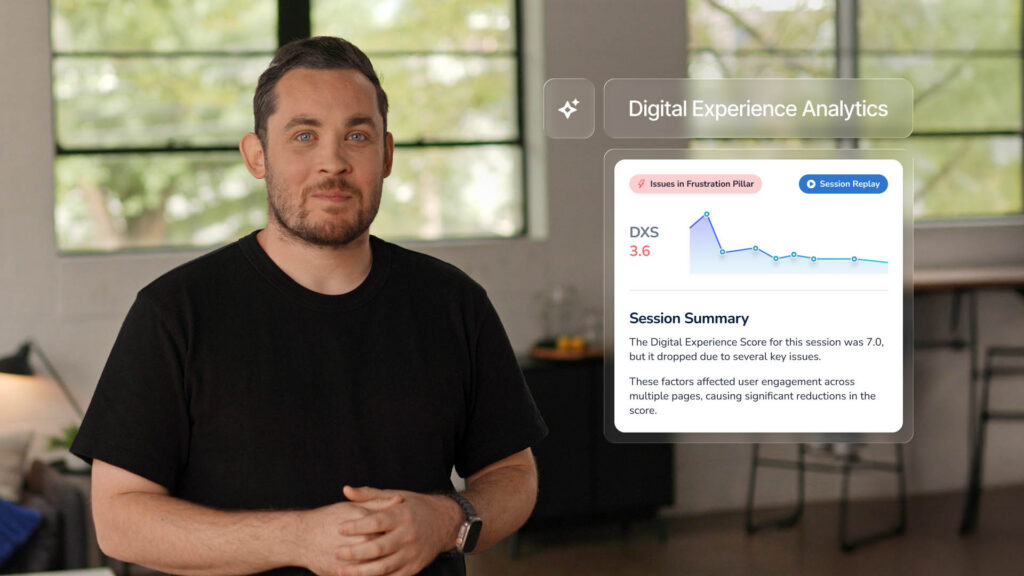
Matt Schweikert: Yeah, I’ve got a marketing creative background so I can build a deck. We all love our decks jazz it up. Try to really bring the storytelling element into the mix. I know we talked about this during our dry runs, but my little exercise in empathy at the end, the cherry on top, we are big power users of DXA.
So I love highlighting session replace, right? That really highlight the problem, the area of friction, the area of opportunity. It’s as close to looking over the shoulder of our customers as we’re going to get. And I’ve, witnessed stakeholders and leaders in real time click when they see that session replay and they see that, that customer verbatim, okay, now I get it.
We have to do something about this.
Joanna Moser: Yeah. Like tying the aggregate data to a very tangible, [00:13:00] real example Yes. Of where that experience did or didn’t work for a given customer.
James Osanyinbi: Totally. Yeah.
Joanna Moser: James, I’m gonna pass it to you. Same question.
James Osanyinbi: Yeah. I’m gonna give a shout out to Kara Brooks, our senior program manager of cx.
One of the things we introduced this year is Medallia voice. So we never really report our text analytics in isolation. We typically have our NPS score associated with it, and we’re using things like Medallia voice to show video examples of the feedback as well. It brings it to life.
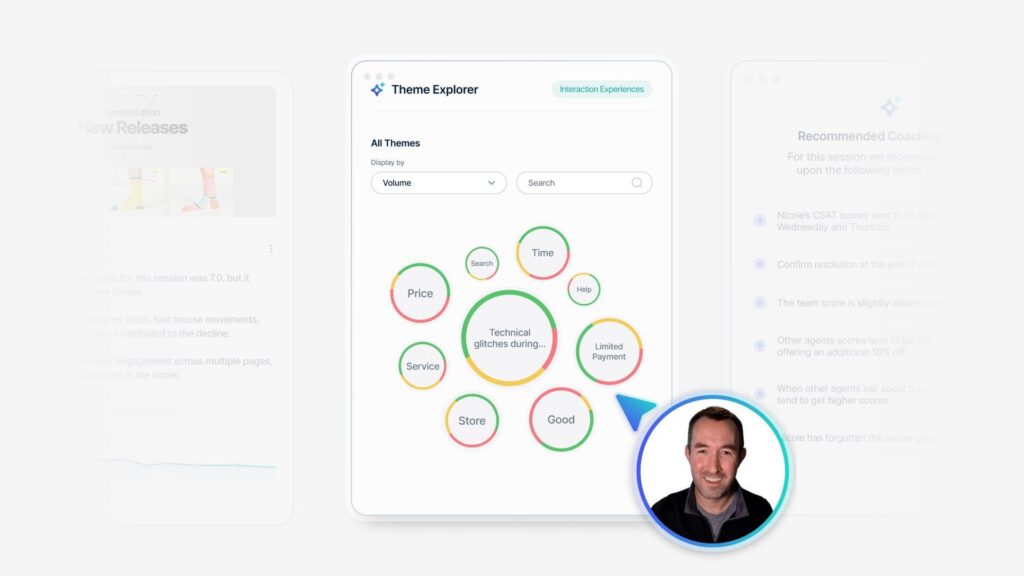
Another thing that we do is look at related themes. So as you all know that for every topic, you have themes that are related. If we’re looking at thing like delivery, that maybe that’s a topic at level two, you may have a theme that related to wait time related to like quality or condition of the product.
So we also wanna show those scores for the themes as well for them to be able to drill down, really understand what are the key drivers. Of the experience the customer’s having related to that topic. And then from there, we’re also looking again at the impact score is what we use to rank. We’re looking at that change in that sentiment score, and we’re pulling verbatims as well.
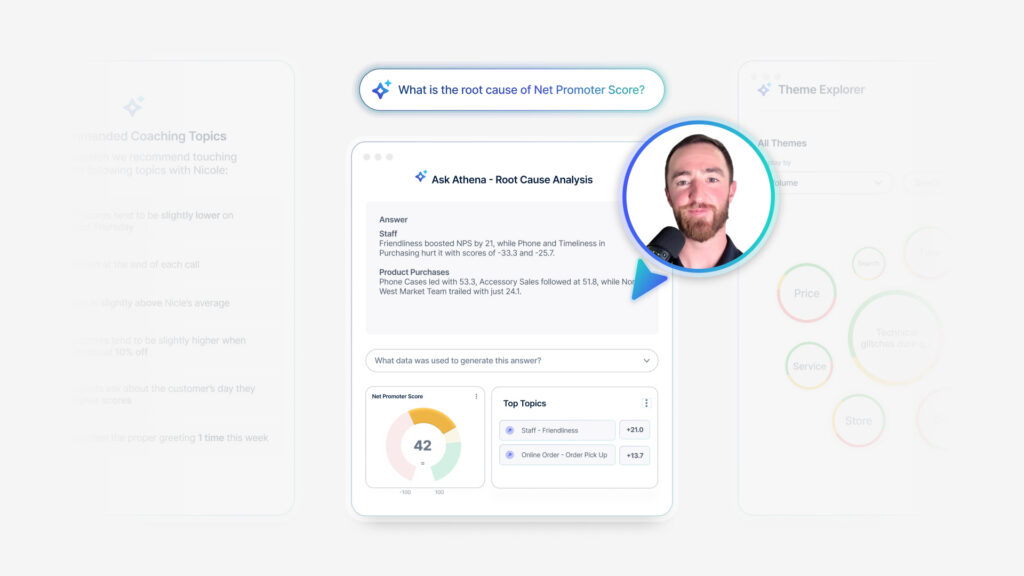
And for somebody that I am [00:14:00] experimenting with AI using copilot, which helps me to take the verbatims and drill them down to understand what are the central themes and story along with that. So we are sharing some of that as well. And we’re looking forward to features in Medallia that are upcoming, Ask Athena, where we can incorporate some of that root cause analysis as well.
That’s on the roadmap. But for right now, we’re really focused on telling the story, looking at the year over year, having the topic, and then understanding what are the related themes associated with the topic.
Joanna Moser: And James, how do you think about tailoring the outputs when you have different types of users or roles?
I know you said you have about 250 stores thinking about, talking to a store manager, a store owner, versus somebody where you’re looking across multiple stores.
James Osanyinbi: When we think about store managers, one thing we have a issue with is sometimes volume. So they may be getting 30 or 40 surveys a month, whereas if we look at the entire chain, we may have a couple thousand a month.
So for stores, we want to emphasize the customer experience. And motivating our associates. So things like employee call out are probably gonna be some of the things I’ve mentioned first. So [00:15:00] if an associate’s named in a positive way, that’s a topic that we have. And then we have a field or we have a view in Medallia on the dashboard where they can look at that.
So I’ll share the information with them and we’re thinking about our field leaders, somewhat the district or region level. We’re gonna look at all of the topics they have that have at least 50 or more responses. And I’m gonna show the net sentiment score and the year over year. So some of the work I do is empower bi, and so I’m using some of the Medallia data and connecting that to some of our customer data so that we can segment it as well.
One of our big core parts of our business is working with contractors, our pros, and so I’m also able to segment our customers who take the survey and look at only those pro customers to see what is unique business case for those folks. So we’ll also segment in that way as well.
Joanna Moser: Yeah, that’s great.
Really thinking about the kind of combination of that structured and unstructured data. To really tailor the kind of outputs to those key business segments. To make sure that we’re keeping things relevant for the business based on our different business goals. I’ll pass it
Shira Whatley: over to you. Yeah, so I work a lot with our brand teams and a lot [00:16:00] of it’s just truly understanding what their business need is.
And so what they come, their question that they come to you with might be fairly narrow, so you just have to think outside the box of what other. Elements you can bring in to really make it a more rich presentation or data analysis. And so with doing that, all the things that you guys were saying, making sure that you include.
Good data. So whether it’s, different scores, the sentiment analysis, impact scores. And then we also try to connect the dots using our consumer insights. So we don’t just have our, guest feedback from the surveys, but also the research based analytics of just the hospitality industry as a whole.
And that kind of just. To helps connect the dots to get the bigger picture for those stakeholders. So it’s not just real time, but also, future based presentation of what they can do. And then we also do different segmentations, whether it’s by. Brand. We do a lot of breakdown by like age and, different demographics.
’cause that’s really important when you’re trying to tailor what you’re doing and how to address certain age [00:17:00] groups and everything like that.
Joanna Moser: Can you share a little bit more about tying, you were talking about some of the broader research that you have about hospitality and about the business and how that helps drive some of the work that you do in text analytics
Shira Whatley: and within Medallia.
A lot of things. We’ve been working on, lately is age-based things is a lot of times, within the hospitality industry, the ones that are utilizing our services are changing. So we have to make sure that we’re adapting our business to that true next gen customer. And so it’s just using all of the information that they have to meet the needs, whether it’s increasing digital or just how people interact with you.
’cause people, depending on how old you are, changes how you want the service to be delivered to you. And so just understanding all those.
Joanna Moser: Yeah, very true. So I wanna talk about maintenance a little bit, maybe a non-sexy topic, but an important one when we talk about kind of enterprise program management.
James, I’ll start with you. How do you think about balancing kind of program maintenance especially with something like text [00:18:00] analytics and the different hierarchies with the kind of needs and requests from your stakeholders?
James Osanyinbi: So one of the things we did this year was very monumental, was a text analytics audit.
So when we started three years ago on the retail side post transaction with the stores, we took the out the box approach and then we created some net new topics around some friction points that we had. I. But I didn’t really have a good sense of our tag rate. I didn’t know what we were doing with the untagged analysis and those comments, and if there were some missed opportunities.
So we took a few months, we looked at our tag rate. It was very healthy above 80%, but there were still some opportunities to refine all the rules. So we really had a medallion consultant come in, Connie, she was amazing, and she took each rule and each topic and we went through line by line and refined those, and that helped us improve our tag rate.
And then we also looked at opportunities to create some net new topics. One of the ones that we created that we still are gonna be utilizing more this year is a topic around likelihood to recommend. So if someone says something specific about what they love about the brand, that’s now a topic.
So one of the opportunities that we did try that didn’t work [00:19:00] as well was product mention. So that was one where if they’re saying tile or wood or stone, then it gets flagged. The issue there, they weren’t specific enough, so the customer was flagging too many things. So what we’re gonna do is tie that more on the back end to our department level, SKU level purchase data.
So we’re really taking a step back with this audit and we were able to see where we stand. We’re in pretty healthy shape. I. With our topic set now, but when we create net new surveys, then we’re gonna have to take another look at it and figure out some new topics and maybe go through the process again.
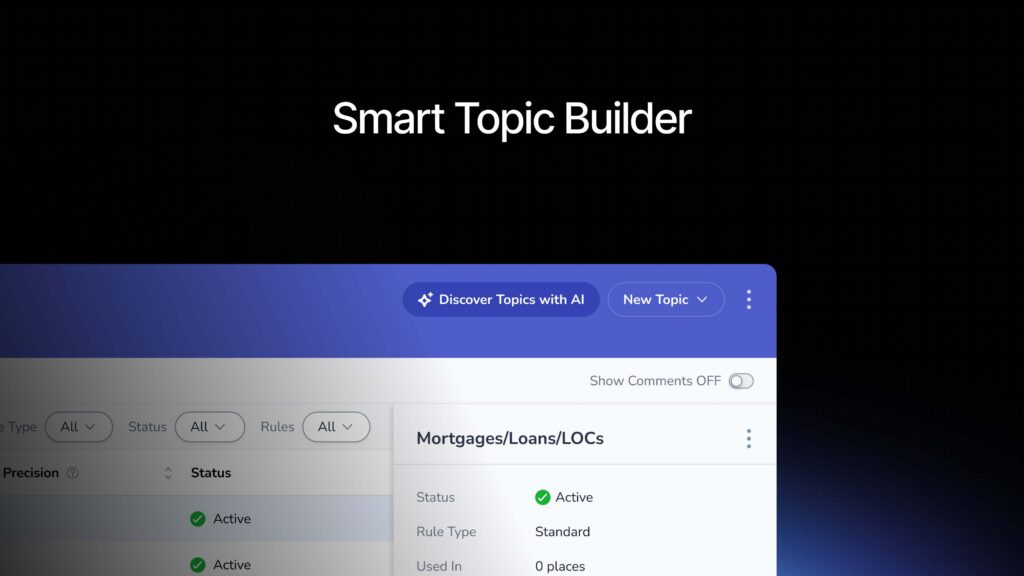
Once we get those new topic sets, what’s pretty much I wanna do at least once a year, where we take a look at what’s our tag rate, and one of the things that we also adopted this year is what’s called the topic coverage dashboard. And so that’s something you can add in the feature of Medallia, where it’s gonna tell you.
What your tag rate is gonna show you those untagged comments. You could export that and do some analysis with it. As Matt said, you could read line by line and really understand it. And then as Shire was saying, connecting it to demographic data will be powerful as well. So those are some of the things we’re currently thinking about.
Joanna Moser: That ties back, Matt, to what you were saying [00:20:00] about this kind of the kind of crawl, walk, run. Yeah. Starting and continuing to iterate and improve. What impact do you see of having these kind of. Regular reviews and kind of this maintenance process throughout your programs.
Matt Schweikert: So I use it as an opportunity to reengage business leaders and stakeholders.
They tend to, not in every case, but in most cases, know their customers better than anybody. Yeah. So bringing business leaders and stakeholders in to review topic sets that we’re currently working with. I. Thinking about what they’d like to add, what they might like to take away. And I’ve seen it really get them re-energized about the work that we’re doing in CX, in VOC.
So taking that, rather unsexy work and trying to flip it a little bit. Yeah. Make it into a positive.
Joanna Moser: It does. And I think it gives the stakeholders a stake. Yes. In the outputs and in the program, when you solicit that feedback, that input regularly. Yeah. So that they have a voice. If there’s something that’s really important, top of mind in terms of their business [00:21:00] goals, they have a place where they can have that built in and added in.
Totally.
Matt Schweikert: I don’t want to be creating all of the surveys that we sent out by myself. You don’t
Joanna Moser: know every single question that every person in your business wants to answer.
Matt Schweikert: I’m getting there.
Joanna Moser: It comes with time.
Matt Schweikert: Yeah.
Joanna Moser: And Shira, a question for you. When it comes to this topic of maintenance, how do you balance program maintenance with kind of evolution and innovation?
Shira Whatley: Right now? We’ve recently changed our survey, so from a maintenance standpoint. As we make changes, making sure that it doesn’t have any kind of negative impact. So we changed some of our questions around and where, our open-ended question was, and making sure that our abandon rates don’t increase.
So little things like that you just really need to keep an eye on. And then we did the topic analysis about a year ago and updated all the rules and we took away some of our bias in our questions. So before we had multiple open-ended questions, so we change the wording of that.
So our text analytics were a little bit more rich. The other thing [00:22:00] that we’re gonna start probably doing is adding text analytics or texting and app feedback into, and so changing that, so it probably even like a different hierarchy. Right now we have one hierarchy that everything feeds into, and so probably trying to adapt that if we bring in different channels so it actually flows and can answer some different questions.
I know ours are more topic based and yours are. A little bit different in that sense. So I wanna
Joanna Moser: dig in. I’m interested for any or all of you something that you said Shira, about the relationship between text analytics and your survey program. In terms of making adjustments one way or another this is a topic that came up yesterday in the Medallia user group session.
And so I was interested if you, if James or Matt, if you guys have had any changes to your surveys or any of your programs based on things that you’ve seen in text analytics.
Matt Schweikert: So I’ve gone through an exercise with one of our more mature programs in the group benefit space to cut down the amount of questions we are asking on our digital surveys before we get to the open-ended field.
A lot of [00:23:00] my stakeholders have mentioned that, the open-ended, that the comment is the most important for them. Yeah. So let’s not ask 15 questions then. Before we get to that point. Increase our chances of abandonment and whatnot. So that’s, that’s been a huge help there too.
Also like on the omnichannel front, right? As we bring more data sources into the mix, thinking, okay, do we really need to ask this question? If we’re able to learn this from DXA. Or from a, call center transcript or something like that. I think that, the more we can do to reduce, will only increase our completion rates and, give us better and
James Osanyinbi: meatier data to work with and for us, one of the things we focused on is that we have a lot of the answers already.
We’re just not mining the data correctly sometimes. So one of the things that we focused on, we have, I have not found as something that we really, that’s important to our business. Did you come in. We are able to find everything to complete your project, and we have a open-ended section that says, please specify what you could not find.
So within there, there’s a lot of plethora of [00:24:00] information about how the, we can better help the customer. So I’m doing like a yearly analysis of that to understand what the trends within that specific question someone says, yes, no. Then also what type of customer they are as well. So when we have new surveys, we’re really conscious of what can we already mind from our existing questions before we build out and ask the customer, were you able to navigate here?
Are we able to navigate there? Things like that, because a lot of those. Topics are within the text analytics. If you build the right rules in the open-ended section, you can get a lot of that information and then you can have a net sentiment score that can tell you how well you’re performing instead of having to make the survey longer.
So we’re being really conscious about the questions we have and then making sure I. If we ask a question, do we have analysis that backs that up to show the business the value of what the customer is saying?
Joanna Moser: Yeah, I think that makes sense. Every time you reach out to the customer, you’re asking for their time.
And so I think that this kind of more modern way of thinking about how do we engage with customers? You’re talking about conversational data going into SMS, looking at what we have [00:25:00] on the website. Yeah. Via dx a and then tying it in with all of the information we already have. It means that we can be a lot smarter and.
Leaner in the way that we ask customers to give us feedback. Totally. So with that, I know Shiri, you already started talking about this, I’m interested in everybody in terms of what’s next. How are you thinking about evolving your programs? The, the world technology, our businesses, our customer needs are changing, I think, faster now than they have been.
Yeah. So how do you, how are you thinking about evolving your program and how is text analytics gonna evolve along with it?
Matt Schweikert: So first and foremost, stressing the importance of the omnichannel view. For programs who are currently capturing an omnichannel view of customer feedback, working with.
Johann and Scott back there on bringing on bringing something like TX profiles into the mix to give folks a, one stop shop without having to jump from solution to solution for programs or [00:26:00] LOBs that, might not have that omnichannel view and are still solely relying on digital surveys.
Sitting down and having the conversation, okay, what else can we bring into the mix? Speech analytics from contact centers, is DXA live on your site or your portion of the broader site? If not why don’t we explore, implementing it. That’s huge for us. I would say number one and probably where I spend the bulk of my time.
Focus on the omnichannel approach.
Joanna Moser: Yep. Bringing it all together. Yes. And I think the thing that’s nice about text analytics is when you have all of these different sets of data that don’t necessarily have a common. Data element to them. Yes. You can use the text component to get that omnichannel view of those different types of data.
James Osanyinbi: Yes. We’re really focused right now on the retail side with the stores and we have the digital. We’re gonna eventually be working with customer care to bring that data in. And then we want to know if it’s one customer who’s been to a store, been to the website called customer care, what is the experience like for [00:27:00] one or two specific topics.
And then we look at the cho, the store level, the division level, wherever, district level. How are we performing on these different topics across the multiple channels, and how are we performing over time across channels? So we’re working with Medallia to start to bring in some of the omnichannel experience data.
Joanna Moser: And I know you talked about the conversational piece, but anything else that you would add in from an evolution perspective? Yeah, we’re really trying to look at that end-to-end journey and so right now we’re looking at, the post-day feedback, which really gives you insights that are good, but they’re past insights and so trying to really bring in that data to really have our front desk have those.
Shira Whatley: Things that are invaluable. So if someone comes in and they want extra towels, if that front desk knows ahead of time and they can address that, they can predict the needs and really trying to capture the data that may come from the app, talking directly to the front desk to have that go through so we can really utilize some predictive analytics and other things for guests just to make their overall stay better.
For our closing
Joanna Moser: questions, I just wanna know if [00:28:00] you guys can share your, a recommendation for folks who are whatever stage of the journey they’re in with text analytics in their program. Just biggest tip for driving kind of engagement and what was the word I was thinking, but engagement and stickiness and adoption of their program.
I’ll start.
Matt Schweikert: So engagement at like the customer level.
Joanna Moser: For your users.
Matt Schweikert: For users. Okay. ’cause I just, I’m the customer, just since I brought it up, socialize the changes that you make based on the feedback that you get. If I spend time filling out five or six surveys a year with the brand that I frequent and that brand doesn’t actually tell me that they’re doing anything with that feedback, I’m probably gonna spend less time on, on those surveys.
Yeah. The following year. So first and foremost, socialize. When it comes to internal user engagement, Scott. Yeah. Aligning CX goals to business goals and objectives. Yep. First and foremost, right? Making sure that they have a lot of skin in the game and then [00:29:00] coming back and trying to showcase that ROI or what the improvement in some of those top level CX metrics means for their business.
Really making it about them. Getting to the what’s in it for me has, proven successful for me over the years.
Joanna Moser: Yeah. That’s great. I love that. Socialize.
James Osanyinbi: Yes. Put your marketing acts on.
Joanna Moser: Yes. Yeah, James,
James Osanyinbi: and for us, it’s show the relevant metrics to your stakeholders.
For example, marketing is a department we work with. When we talk about things like brand value, our price, our selection, we have topics that relate directly to that. We have CSAT scores relate to that. So if I’m meeting with them on a monthly basis, on a quarterly basis, if I’m meeting with the executives that are on our board, I want to show how those measures are doing.
Then also when we have projects. They’re closely related to our topics. I wanna show what those topic scores are three months prior to when the project started. Yep. In the middle of the project and then at the end of the project to see do we have any growth and can we attribute some of that to the changes we made as a business.
Joanna Moser: Yeah, I love that. Relevancy and timeliness [00:30:00] to the key business goals and initiatives. Exactly. Alright, so since you guys talked, some things I was gonna say, so I’ll do it a little bit more specific that I think that really evaluating. Your topic hierarchy. I think that is important. If that’s not something that you have done recently to make sure that you go through and do the formal process with Medallia or even just look at those themes and if there’s certain, things that are popping up, maybe you might need a topic for that and make sure that your rules make sense that you adjust the rules to truly be the way that the people are speaking.
Shira Whatley: You really have to read the comments to make sure the rules make sense, and I think making sure that they match what your stakeholders are needing as well. And so just. Evaluating your topic hierarchy on a regular basis. Yeah,
Joanna Moser: that’s important. The outputs of the reporting are gonna be tied to that hierarchy.
So making sure it’s relevant to your business goals today versus the goals you had when you were first setting up the program. Absolutely. Is really important.
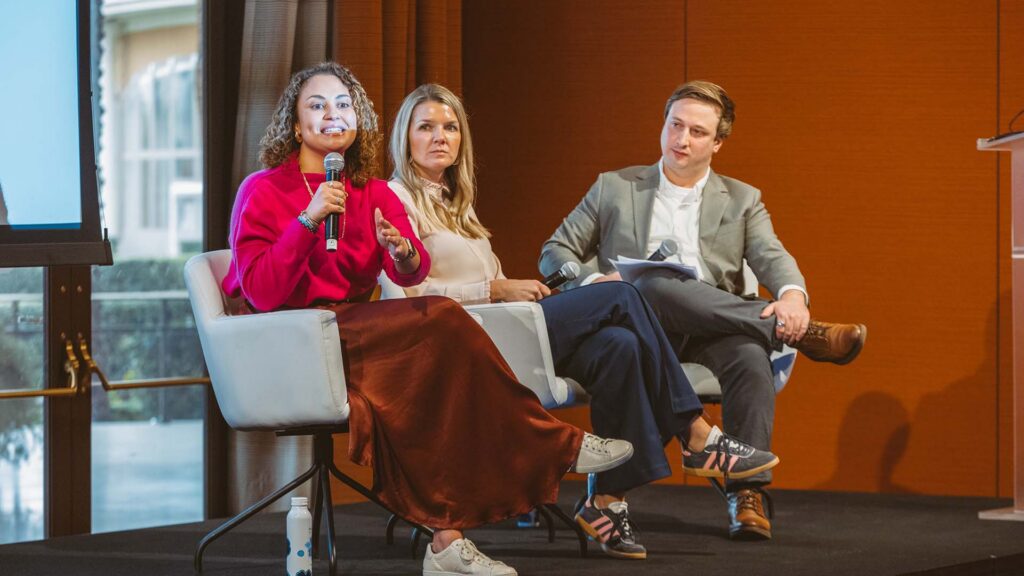
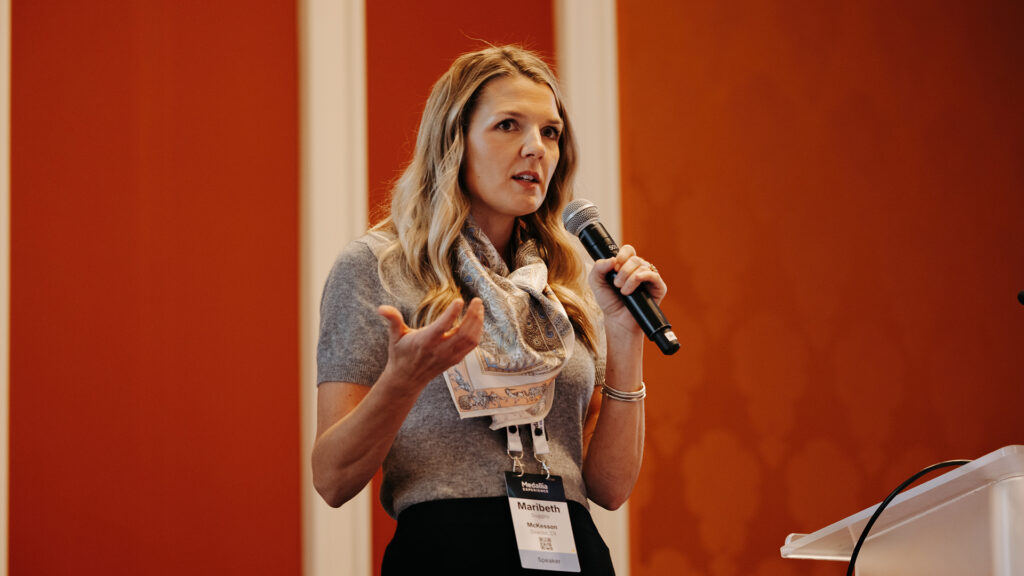
Q+A: Okay. I have two separate questions that are unrelated. Alright. So feel free [00:31:00] to answer them separately. I work for Bath and Body Works and we are lucky where we have.
So many open-ended comments come in, and usually I’m looking at them like a monthly hindsight. Now all the comments are filtered by time. I don’t wanna look at a single day. There could be. 5,000 comments from one day. I wanna look across the entire month and I usually filter for negative if I’m looking for opportunities or positive if I wanna, give us a crumb, but I wish I could filter by most negative or like theme within the topic.
To see the comments and I dunno if that’s an option. And then my other question is, so we have questions like metrics in our survey to get a quant score for like ease of checkout. Now we have year over year trends. So our ease of checkout for stores is maybe getting better. Like we’ve seen improvement.
And then you look at the text analytics and the sentiment is getting more negative. Or you specifically look at a specific response and they’ll give us an easy checkout score [00:32:00] of five. And then they tell us they waited in a really long line and it was really annoying. So like how do you marry quant qual when they’re trending in a different way?
Do you need to evaluate the text analytics? Like maybe, or maybe the quant isn’t what you think you’re asking, or they’re answering it in a different way. But yeah, those are my two questions. Great. I’ll answer the first one very quickly. Yes, that’s possible. Feel free to come up at the end and I can talk you through it.
Joanna Moser: But for the second question, I’ll pass it over to you guys. One of the things I do is mentions per volume. So for example, we have a topic around product selection. I’ll look at mentions per 1000 comments. So that’s something I’m building a little bit outside of Medallia and Power bi, but you can do that in Excel or whatever platform you have.
James Osanyinbi: So that I’m able to see is the frequency increasing related to the other topics rather than just looking at the sheer volume. ’cause sometimes as you’re improving a service, you’re gonna get less feedback about a topic because it may be related to something that’s negative, but you’re still improving in that [00:33:00] topic because it’s being mentioned less frequently.
So the score is still gonna be negative. But you’re having the volume you go down because it’s less of a friction point. So you could also highlight that to your stakeholders as well, because some topics are typically always gonna lean more toward the negative side, just because people aren’t gonna talk about some things if they’re great.
You’re only gonna mention ’em if it’s a negative experience. But then you can look at the volume and kind of relate that story to what you’re seeing from like things like ease of effort. Like regularly evaluating those questions that you’re asking, and it seems like bath and Bodyworks is doing a great job using customer effort score to, to measure the success of a checkout.
Matt Schweikert: But we used to include a net promoter question on literally every survey that we deployed. And yes, it’s an important metric, but it just doesn’t always have a place if you’re trying to measure a transaction. Don’t ask a relationship based metric there. So I think that’s one.
Second would be impact scores. Going back to your first question, I love impact scores. Team knows I love impact [00:34:00] scores, and I think that they help with that quant versus qual piece that, that you’re looking to solve for.
Joanna Moser: Yeah. And I think something to keep in mind when you’re looking at the quantitative versus the unstructured, especially with surveys, is that not every person who takes a survey is gonna leave a comment.
I think that’s where the impact scores are helpful, which is when customers leave comments, are they pulling up or pulling down the score? Because that can be indicative of the folks who aren’t leaving feedback or who aren’t. Answering those questions. So it may be that, customers who have a good experience leave high scores and move on without saying anything.
But when they have a bad experience, they’re gonna leave more information.
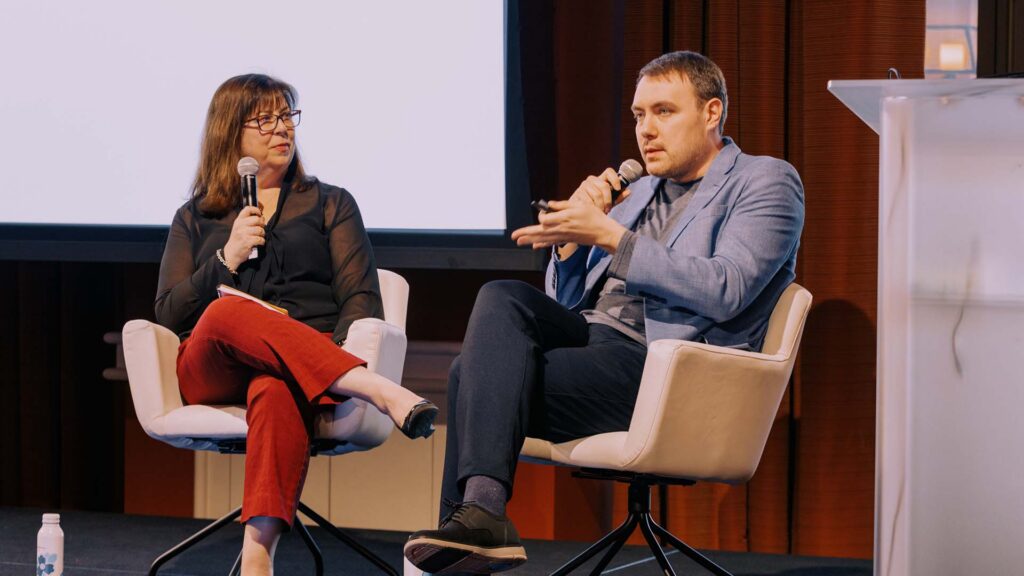
Q+A (2): How’s it going panel Tyler from Independence Blue Cross out of Philadelphia. Go Birds. I actually have a specific question for James. I know I’m picking on you, but you mentioned a topic around LTR. And it, that actually really piqued my interest.
I’d love to know a little bit more about a, how you built that and B, how you’re using that to impact your program in your organization, what it’s being used for. ’cause that’s something I took a note on and we’ll probably do.
James Osanyinbi: Great [00:35:00] question. So that was really an idea that came from Medallia during our text analytics audit.
It’s been a couple months. So our plans to use it are that when we have opportunities with marketing or other stakeholders that like to basically be able to have. Customer feedback, that’s really positive. We want to use that as examples of verbatims of positive experiences. So we haven’t had a chance quite yet to start to socialize those comments, but we are getting some good traction on them.
Sometimes they’re a little vague. So what I like to do is, when text analytics are broken up, you have the entire comment that you have the phrase that’s tagged. So I’ll go back and look at the entire. Comment and see if there’s more within that to explain why they gave us that score. So our plans are really to socialize that more so with the marketing team and then eventually operations.
But it’s really meant to be able to give us a quick snapshot of we have these great NPS scores, here’s a couple reasons of why people are saying that we are a great brand.
Joanna Moser: Those types of topics can also be good opportunities for like positive closed loop. Follow up with your customers who are like [00:36:00] above and beyond happy with the experience that they had.
It could be a good way of looking at the positive as well as the kind of standard detractor type of follow up. That’s a great point because one of the things we do, we close a loop with our detractors, but we’re looking at promoters and passes as well. Even maybe some opportunities for follow up surveys to really understand more about the experience, because often we focus on the negative or the friction points when those strengths are really what also gonna give us.
James Osanyinbi: More customers, better experience. So that’s something we’re looking at as well. What strategies have you all seen with using text analytics to get operators more engaged with understanding how to use text analytics effectively at their level.
Matt Schweikert: Bring them into the topic, build out. Pick their brains, leverage them as the experts that they are, and have them build out your topic hierarchy.
Shira Whatley: I think sometimes it’s. Showing them, just making sure that they know how to build a story so they can really dig in and see what impact it can have. And it’s socializing them with [00:37:00] it so they know how to use it. And just the benefits that there are because it’s great. You really can build great stories from all the text analytics.
And I think if they see those examples and they can see where. Other stores maybe have made some changes that can help. And yeah, just making sure that they understand how to use it. ’cause sometimes it’s scary if you don’t know how to use a portal or you don’t know how to do things, it’s just, too much time.
So just show them how easy it is.
Joanna Moser: Yeah, I love that. And I think like incorporating into your kind of. Training or enablement material, not just like how to use it, but why to use it. Yeah. And having those examples and for you, like real life examples, right? With your, when you’re within your own business, you can share those examples of success.
I think that really helps drive buy-in.
James Osanyinbi: When you’re a store and you’re in a certain state, sometimes you only have visibility really into what’s happening on your day to day, and you don’t get visibility to your topic sets and topics that are mentioned maybe in other places in the company.
So find ways to help share with them at a high level. One of the things we do is a quarterly newsletter where we’re sharing at the [00:38:00] chain level, what are the top and bottom topics, and that goes out to our store field leaders. So that’s one way. And then also, again, help them to be comfortable with the information and how to access it in Medallia.
Joanna Moser: We are at time. Thank you so much for joining. This was great.