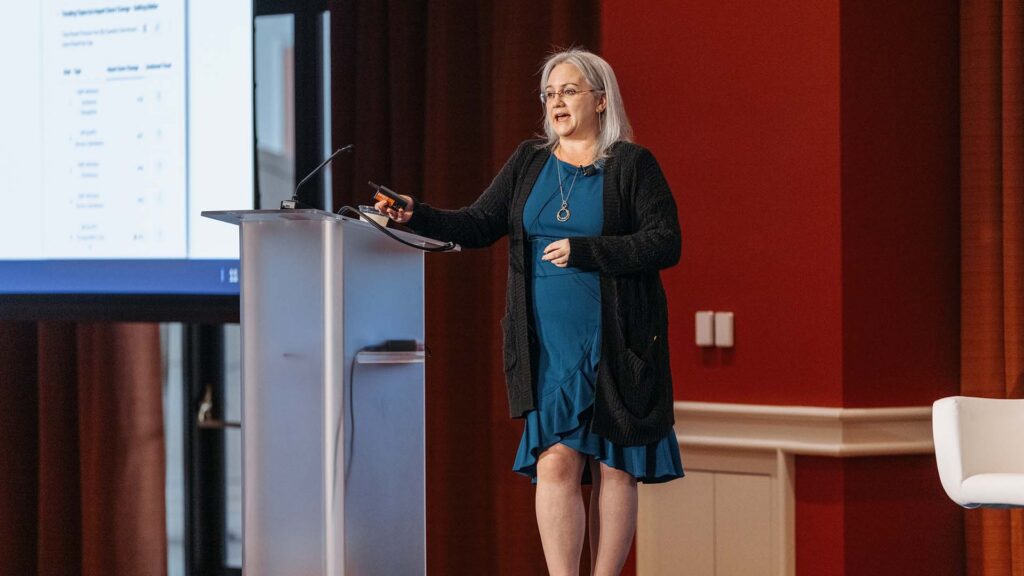
Maribeth Duggins: [00:00:00] Welcome everyone. Thanks for coming in today. I wanna first start with a question to ask you in your organizations, do you have one team that’s responsible for bringing in new business? So a sales team, and then one team that’s responsible for retention and account management. Raise your hand if that’s the case in your organization.
Okay. Looks like a fair amount of people. So I’ll start with kind of a story about McKesson and our account management team. We about a year or a year and a half ago. We were in a leadership meeting and as a point of note and praise our our, one of our heads of business said last year we did really well for every one customer that we lost, we gained two new customers.
And that was like amazing. I’m not a math whiz, although. I do have an 8-year-old and a 10-year-old, so I’m learning the new way that they do math, but it’s still just like a net of one, right? We’re still doing all this work and we know as CX professionals that it is much more expensive to acquire new customers than to retain [00:01:00] existing customers.
So I started thinking about account management in general, and retention in thinking about, we had talked as an organization once a customer leaves, having the discussion around why they left, but we really weren’t having that discussion before. And so that was a really critical moment to start for us thinking about getting ahead of it and instead of, looking at churn and what happened there, thinking about how we can mitigate churn.
So that’s one of the things I wanna talk about today as far as predictive account health and thinking about being proactive with your customers. One of the things with thinking about addressing churn is that you really have to be able to monitor and measure it. So as the strength coach, as my at my gym says, if you’re not measuring, you’re guessing.
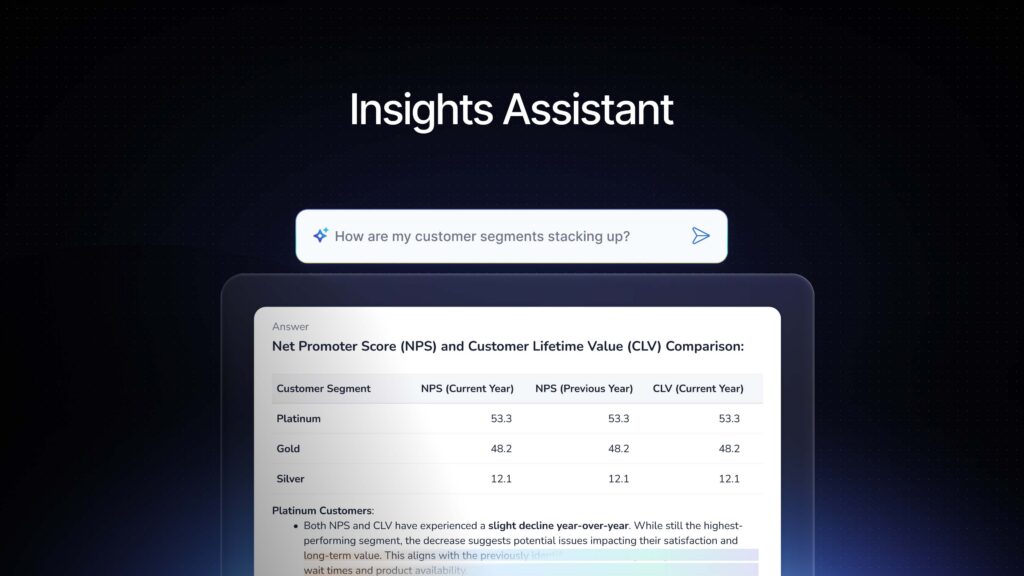
So you really are guessing if you’re not being able to put some metrics behind your account. Retention numbers. The other thing that we were able to do by looking at predictive account health and pulling in all these metrics into one place I. Was to be able to start looking at [00:02:00] correlations between some of the drivers of satisfaction and looking at some of the solution bundles for examples that our customers were purchasing for us.
Looking at some of their purchasing habits to try and predict their behavior. I. There were also opportunities that we found where we could upsell and really grow the existing business that we had with these customers just by knowing a little bit more about them and bringing in these metrics into one place.
And then the third thing, and this one’s kind of a selfish one, but hopefully it will resonate with you, really the idea of using data to create credibility within customer experience. Both within the function and with us as individuals. So a little bit about McKesson. Has anyone ever heard of McKesson?
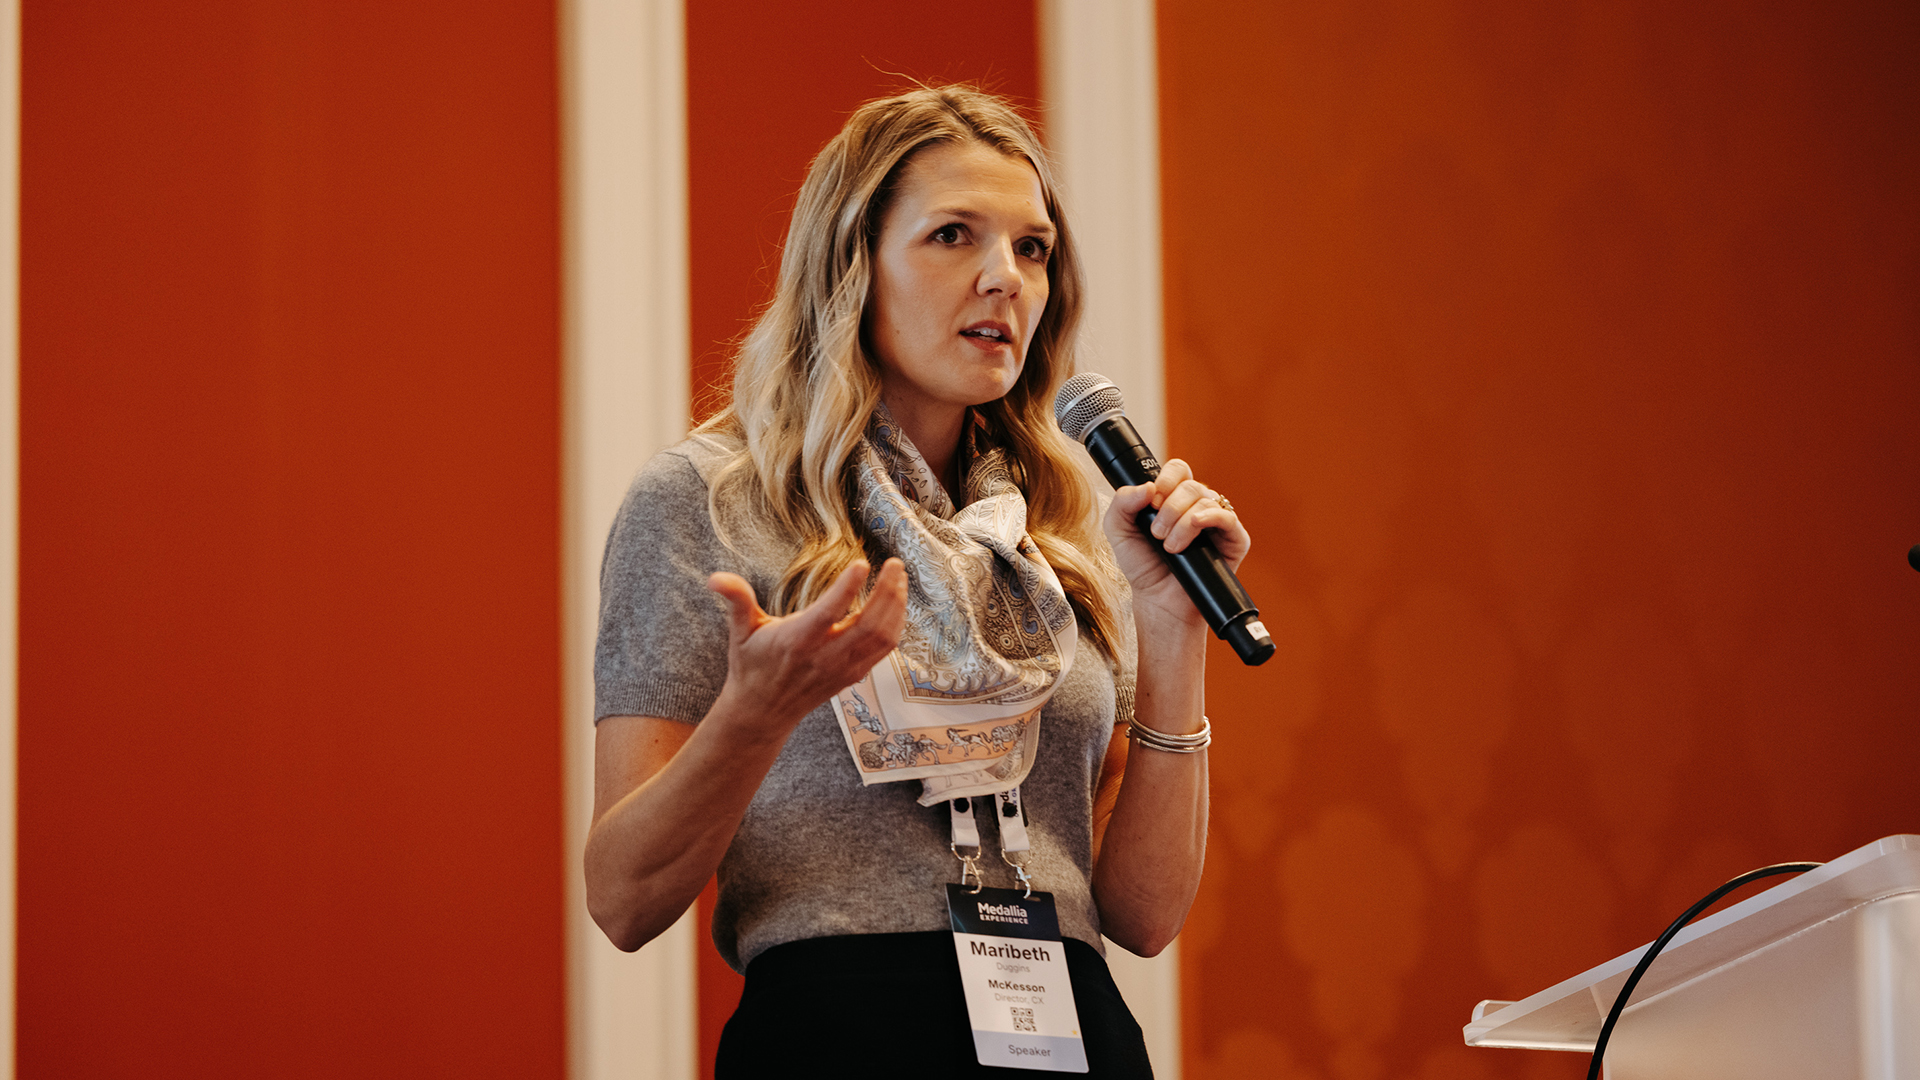
Raise your hand if you’re familiar. All right. You don’t count, but thank you. So when I joined six years ago. They called it the largest company you’ve never heard of, and that was only six years ago. And so I imagine that it’s still about the same, but we are the largest healthcare company in the United States.
We touch about a third of all medical supplies and [00:03:00] pharmaceuticals that are distributed across North America. So we’re very big. We’ve been around since 1833. So a very old company. We are number nine on the Fortune 500, and we did about 300 billion in revenue last year. So we are large. I run CX for a certain part of the business, so I’m gonna talk about that today.
But we really touch and play in all areas of healthcare. I’ve talked to a lot of you over the past couple days and thinking about CX at different companies and what that looks like and what your role means depending on what company you’re at. So it’s in my mind, a tale of two CX practitioners.
There’s. A wide range. Everyone from, someone who is able to develop a robust program and use AI and all the smart things that we learned about in these sessions, and really pull in all these metrics and signals. And then you’ve also got companies where CX is operating on a type budget where you’re expected to do more with less, and there’s not necessarily the investment there both.
From a dollar standpoint and from a headcount standpoint. So spoiler alert, these are both me. [00:04:00] So I tell you all this because I just told you how big and powerful McKesson is, but I don’t want what I share with you today to feel unattainable if you are not at a Fortune 10 company. This is something that I’m managing just for one part of the business.
I’m a team of one, aside from my Medallia counterparts. They count as part of my team. And so part of this too is really reliant on. Strategic partners. So whether they’re internal partners to your business and working with your business partners or, third party agencies like Medallia that you can lean on.
I’ll share a little bit about our journey, and it’s not very long my journey with CX and really McKesson’s provider solutions journey with cx. So I started at McKesson in 2019, and in the beginning of 2020, I was assigned this. Side project. That was our annual customer experience survey. So once a year, every January, we would get all of our customer contact information.
I see some heads shaking. Get all of our customer contact information, put together a survey, make sure [00:05:00] we were asking the questions that the business wanted to ask. Oh, you wanted to throw another question in there? Sure, let’s add it. Build it all out. The executive team would have me come and present. I would share all of the data while out of Excel, drop it into PowerPoint.
Share all of our analytics around customer experience. And then, see you next year. We’re gonna put this away in a file. It’s really just a side project. We’re gonna pick it back up next January. From there in 2021, we stood up a customer experience task force as the business started to understand a little bit more about the importance of customer experience.
And so in that task force, we had several different work streams. There was one around customer onboarding that we called make the first time the charm. We had one. Around customer communication because we got some feedback from our customers that we were spamming them with emails. So we wanted to focus on consolidating some of our communications and looking at those vehicles.
And then we also had a voice of customer work stream that I led with that Voice of customer work stream really emerged this formalized CX program. And even [00:06:00] before that, some of the things that we were doing with this work stream, we did bring a consulting firm and paid them a lot of money to tell us that, maybe we should survey our customers more than once a year.
So that was a big inventive idea that they had for us. And so with that, luckily in 2022, we were introduced to Medallia who said, actually, there’s a lot more that you could do than just surveying your customers multiple times a year. But we’ll start with, yeah. Getting a better pulse on your customers.
We started with the formalized CX program in 2022, and then as we got used to that and got better at that in 2023, we were able to start doing actually cool things like closing the loop on feedback. We were actually able to, for the first time, respond to our customers because for the first time we actually knew who was saying what.
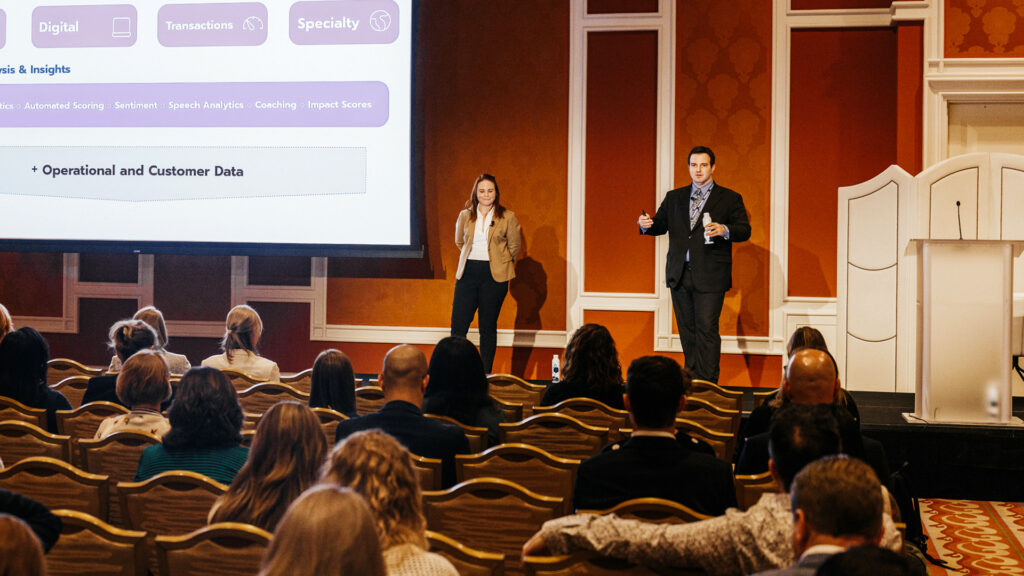
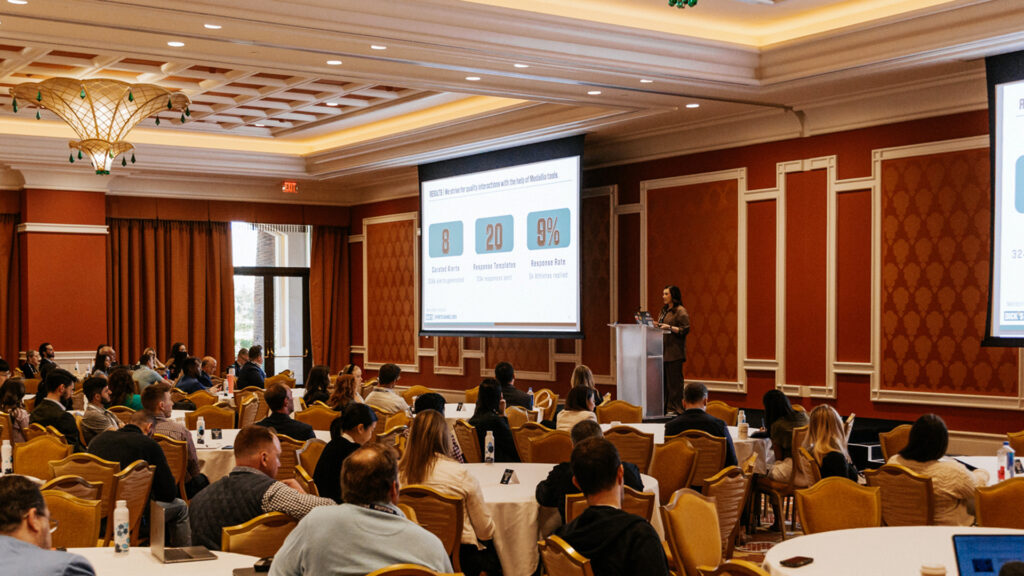
Prior to this, it was an anonymous survey and we couldn’t respond to them because we didn’t know who it was. And so from there, last year, the end of last year, we got into predictive account health model that I’ll share with you today. [00:07:00] Much like our customer experience program evolved out of a project, so did our predictive account health model, and this is an actual slide.
That I used, that was the result of this project. So we had heard a lot of anecdotes from our field account team, and we had seen it in Medallia as well. You can see the NPS impact score up in the corner that we were getting a lot of flack. Anytime customers had to go to our finance team, they hated dealing with finance, anything related to billing.
Our field account team said we’re trying to get finance to change their process. We want them to fix what’s wrong. Because they’re really pissing customers off Anytime we have to send to them and we have to, it’s billing issues. It’s invoicing. I went into Medallia because we now had text analytics and an impact score, and so I could pull all of the feedback and say, these are all the customers.
Who had negative things to say about the finance team. Now, we did not solicit a question around finance. It’s just in their open-ended text, and by the way, it is having [00:08:00] a negative impact on our overall NPS score. That’s meaningful in itself, but I was able to take it one step further and as a team of one, this was a very manual process.
You can see this $49 million in the bottom left corner of your screen. I took every single customer, I took the customer name out of Medallia, where I saw that they had provided negative feedback around billing. I went up and looked those customers in Salesforce to understand what our annual revenue was so that I was able to, for the first time, say not only is this a problem, this is a $49 million problem, and shockingly, that did get the attention of finance and they said.
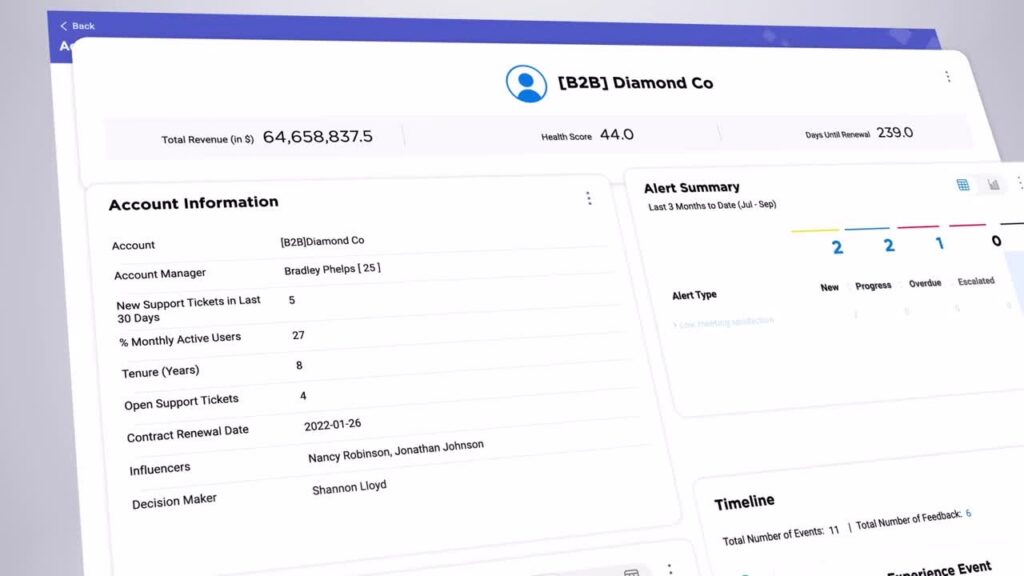
Okay, maybe we will look into fixing something. So we started building out predictive account health just because of this one standalone project. Because the business felt that there was a lot of value there once we could assign a revenue number to that. So the other thing, with creating this account risk model, and you can see here all the different places that today we’re able to pull in data from, but this was really the start [00:09:00] of a scorecard.
And if you’re familiar with Covey’s four disciplines of Execution, the scoreboard is very important because as Covey said teams play differently when you’re keeping score. And nPS is one score. But now that we were able to pull all of these different signals, so pieces of data that we had on our customers, we could pull them all into one place.
And now we created what we called an account risk score. And today, that is the measure of how healthy that account is. So are they high, medium, or low risk? Based on over 120 signals that we’re able to pull in. I mentioned that things are disjointed at McKesson. I’m a one person show. I am only in charge of relational NPS.
That’s the only area that I have authority over. These others, the post order NPS data, the marketing engagement tool, those are all data feeds that I rely on from other teams. And even though they come from different data sources, I like to joke and I only joke because if it wasn’t funny, it would kinda be embarrassing.
But we use almost every survey. [00:10:00] Tool that’s out there, we can run it through Qualtrics, Medallia, SurveyMonkey, even if you need a Microsoft Forms, we could do that. So these are coming from a lot of different data sources, but we were able to pull it all in because now we had one place within Medallia where we could host all of these different pieces of data, all because we had one common identifier.
And for us, that was the parent account number. So as long as we had the parent account number for all of these different things, we could pull it all into one place and say, this is the story of customer 5 2 7 1 3, which is X, Y, Z practice. And so pulling in from these different places, there’s a number of different things that are included in each of these.
So for example, within our relational NPS, we pull in the NPS score, which is obvious, but also we pull in satisfaction, business value, how much value the practice. Feels that they’re getting from McKesson and a number of other things. And that’s true of all these. So the contract data, we pull in their spend, [00:11:00] we pull in their contract renewal date, which is big when you’re looking at accounts at risk, because as you can imagine.
If there’s an account that’s unhappy and their contract’s almost set for renewal, that’s gonna garner a little bit more attention and need, maybe someone from leadership to step in. So we pull in all of these different pieces of data. But what I think is most unique with this is that because we had all these pieces of data in one place, now.
We could start to create new signals. So in our relational NPS, for example, we ask our customers to self-report what their annual drug spend is. And then in our contract data, we know now how much they’re spending with us, we were able to create a whole new signal that was called share of practice spend.
And so by doing things like that, we were starting to piece together the pieces of the puzzle and understand a little bit better where we stood with these customers we have within our provider solutions business alone. So again, that’s the business that I [00:12:00] manage CX for. Within that business alone, we have over 6,000 customers.
Leadership does have a good grasp on what the customer feedback is for. Probably, I would say, the top 20 accounts. They know pretty much what’s going on in that practice. But that leaves, I. 5,000 plus accounts where you know, you’ve either got someone from inside sales measure or monitoring a lot of accounts on their own, but there’s just no way that we could possibly understand what’s going on with 6,000 customers.
Without having data to tell us where to act, and with those multiple data sets that I showed you on the previous screen, we’re also asking our sales team to go look at this and this. Go look at are they engaged from a marketing standpoint? Are they opening our emails? What’s our sales numbers?
So being able to simply bucket them. So we calculate a risk score. We give them a risk, and there’s different weights assigned to each thing. And that’s another thing that I love about the account risk model that we’ve developed with Medallia. It’s fully customizable. So our first pass was just [00:13:00] taking a guess at the things that might be more impactful in thinking about retaining a customer.
So for example, we offer technology solutions. So our core business is distribution. But we offer like technology solutions. We have our own electronic health record system for oncology. We also offer inventory management. But for example, when a customer utilizes our inventory management, we physically put hardware into their practice.
So it becomes harder from the buy from a competitor because we are in their practice. And so something like that would indicate to us that they’re a little bit more sticky, a little bit at less at risk for churn. So our first pass through is just making these guesses and these inferences based on, things that we had seen in the past.
But thanks to the Medallia team to mooching she ran all of our active accounts and our inactive accounts through the tool so that we could start to understand. What were the commonalities between all of our inactive accounts in Salesforce, meaning all the accounts that were customers of ours and were no [00:14:00] longer, and that’s how we were able to validate some of the signals that we assigned to these accounts.
And then you can see here, the waiting is different just depending on the signals. Certain things have a higher weight, and then overall the account gets a risk score. And that risk score is associated with a bucket, high, medium, low, super easy to understand. Leadership goes in there, they look at mainly just the high risk accounts.
What can we do today to address this? And the other thing I mentioned was the correlations. So you can start to make correlations between the data as well. And so thinking about opportunities where, for example, you’ve got a customer in here, now you can look at their spend data. So maybe they’re low spend, but they’re high satisfaction and they’re highly engaged.
That’s an opportunity for us to get a higher share of their business if we just take it, if we’re just proactive about it. The other thing we, I started to look at was our spend and our relational NPS score based on solution bundle. [00:15:00] So I mentioned our technology. I won’t say this one technology by name, but one technology that we offer.
I saw that four customers who utilize and pay us for that technology, 95% of those accounts fell in the at risk category, which then tells me. That maybe we should consider not putting our whole distribution business at risk in the long term for a short term sell of one piece of technology. So these are the conversations that we’re starting to have with the business because we have these correlations and it’s really hard to argue when the data’s right there in front of them.
I’ve thought a lot about whether NPS really should be a lead measure or a lagging measure, and I guess it depends on what you’re relating it to. So I think it is a leading indicator of revenue. But then for me, like these are the types of signals that are leading indicators for the NPS, so you can start to understand already what’s going to create a positive experience with your customers.
None of this would really be [00:16:00] possible if I operated in a vacuum. And so for me, what’s really important is creating a cadence of accountability within our account management teams, giving them access. I mentioned the scoreboard. The scoreboard doesn’t really matter if they can’t see it.
So there needs to be that accountability there. And that’s all driven by culture. And that’s what I mean when I talk about, CX credibility within the business, with the business, being able to come to me and say things like, more about my customer than I do, and you’ve never stepped foot inside their practice before.
That I can share those metrics back with the business to be able to make business decisions and start to drive strategy. We actually just recently had a conversation. Our fiscal year starts on April 1st, but over the past three months we’ve started talking about. What are the metrics from within this tool that we can use to drive our FY 26 strategy and start to think about what our strategy is in terms of our customers.
I have a few final thoughts and then I would love to hear from you whether it’s questions, comments, I would love to hear. You saw my journey. It only started two and a [00:17:00] half years ago, so by no means is this the only way to do it? So I would love to hear how others are managing this, but really, to circle back to the beginning.
This is all about addressing and mitigating churn. Churn really is a lagging measure. Once it’s happened, it’s helpful to go back and look at sort of a win-loss analysis and understand, why you lost a customer. I. But that only is helpful for maybe the next customer. It’s not gonna help you in that instance because your customer has moved on.
So thinking about churn, digging deep really to understand like what is influencing that churn and how you can play a part in mitigating it before it’s even happened. And then also, reiterating the fact that you can identify opportunities for growth once you understand what’s driving. That positive relationship with your existing customers who are happy and satisfied and buying a lot from you how do you do more of that with your other customers?
I talked to someone recently within my organization who said, you do all this by yourself. And I said, yes, I do this all by myself. And so I do wanna take [00:18:00] credit for doing this, but it really wouldn’t be possible truly without having a platform and a team to support these initiatives. So with that, I would love to hear any feedback, comments, questions.
Q+A: Hi, my name is Stephanie. I have a quick question for you. Before you started this process, did you internally have any retention go? Goals
Maribeth Duggins: or the goal was just to look at retention. So yes, we do have retention goals, but we were using NPS to look at that. But it was still, we still only run our relational NPS once a quarter.
So it’s still just like a cadence to ha kinda have a pulse on the overall relationship. And our customer contracts are around three to five years, so they’re relatively long. But we really just had no idea that we were about to lose a customer before it was too late. So they helped with that.
Q+A: This is really relevant. I love it. So just another quick question. So do you have like a year over year. I love the way that you projected this is what we can lose if we do nothing essentially. Yeah. Like [00:19:00] the cost of inactivity. Do you have a year over year or like a projection of what you’re looking for or turn?
No, but we
Maribeth Duggins: will, that’s the thing is that this is all relatively new and it’s getting a lot of an adoption by the business. But I hope to have this conversation with you next year and be able to share. ’cause previously we’re focused on year over year NPS and we have seen that grow based on things like closing the loop.
But as far as this account risk we’ll see, we really just rolled it out in the last few months and we continue to build. Just two weeks ago we were talking about adding new signals and as, as much as I can talk about this within the business, I have people coming to me saying.
We have some data on the customers. Can you put that in there too? And so it’s just gonna continue to evolve. So yes, that’s the hope is that next year we will have a year over year of where it’s gone.
Q+A: Super helpful. Thank you. Thank you.
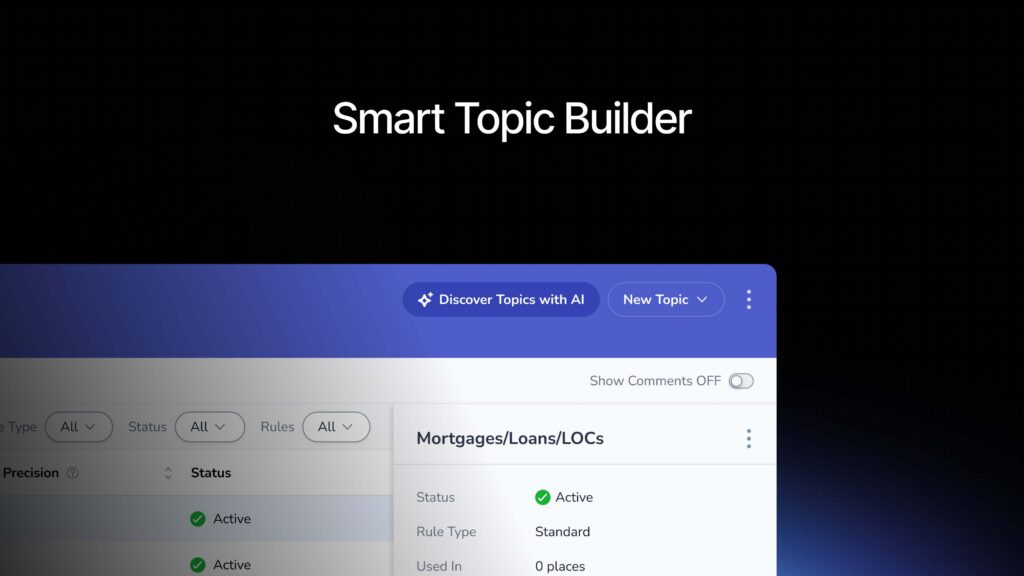
Q+A (2): I’m wondering if you’re using your open commentary, if you’re using topic sentiment as part of your risk model today and how you utilize those in comparison to the scores.
Maribeth Duggins: Yeah. Yeah. So we look at that. Really for us, the topic [00:20:00] impact score. Is something that we really care about. So looking at how that topic impacts the overall NPS, that’s part of our model. And, sorry, you had a second part of your question.
Q+A (2): Oh just if you’re using topics and sentiment based on open comments,
Maribeth Duggins: yes, we are.
So we are using those open comments in there. And then that’s just a good way too, to spot check. A lot of times when I pull something together for my team I will put in a couple verbatims so that they can just read it in context, because the metrics are important, but they wanna understand what the customers are saying too.
Yeah. Thank you.
Q+A (3): So when we look at our accounts the best predictor of if you’ll be a CVS Caremark. Client next year is if you’re a CVS Caremark client this year. And so you’re saying, you have three to five year contracts. What, how did you, how do you get around that issue of basically if you look at the correlation of data, you know that all of these things actually are predicting whether or not they churn?
Maribeth Duggins: Yeah. For us, we operate against two main [00:21:00] competitors, and we all offer just about the same price. So for us it is we win on experience. So you’re right, like keeping our existing customers, but we had a hard time understanding what it is about our existing experience because. Our customers within the area that I sit within, provider, they interact with on average five to eight McKesson teams.
And I will tell you that as a McKesson employee, I find that hard to navigate. So I know that the customers have trouble. And so it’s just identifying those pain points in the journey because oftentimes, the account manager thinks everything’s great because they have a great relationship. But they don’t know until they look at this data that their customers called into the call center 10 times and it’s taking us five days to resolve their issue.
And so bringing all those into one place also helps. I would say too, from an employee experience, we don’t have a full employee experience program yet, but thinking about helping those account managers better do their job too, is a big part of this. Yeah. [00:22:00] I think
Q+A (4): how does a team determine what is and what does not churn?
So we have been debating for over a year
Maribeth Duggins: just
Q+A (4): to define that.
Maribeth Duggins: Yeah. And then that’s a fine line too, I think because now we know when they’re at risk, but when they have churned for us is when their account expires. And so we sell and distribute drugs. But they buy through a group purchasing organization.
So they have on contract, for example, committed quantities and so they buy everything on contract. They could still buy from us off contract, but for us, churn is once their contract has expired and they have not renewed.
Q+A (5): Can you talk about how you plan on the 12 to 18 month? Like how is this gonna be embedded in the ecosystem?
Yes. And a few of the challenges that you had getting at traction internally for it.
Maribeth Duggins: Yeah, definitely. I would say one of the challenges internally was just questioning the data. And actually having that running our active versus inactive accounts through it was huge. That came up so many times when I was [00:23:00] rolling this out and I was so glad that I had that in my back pocket to be able to say.
Yeah, we have actually run our current customers compared to our lost customers in there. And so sharing that was helpful there. And then as far as the roadmap going forward, the capability exists, we’re not ready for it quite yet. ’cause this is still new for us. But one of the things we are looking to the future to do is to take these, high, medium, low, a simple flag, a red, yellow, green flag, and push that back out into Salesforce.
So that our contact center employees have access to that and they know when a customer calls in, this is a high risk customer. And so we’ve talked to our co contact center counterparts. To say, could we do some skills-based account routing? So if someone comes in who is already a higher risk customer, they might already be upset.
We want to route them to someone who’s more senior. So those are the kind of things that we’re looking to do with this data going forward is to get, even one step more proactive. It’s [00:24:00] all going from this reactive mindset into proactive way of doing things.
Q+A (6): I’m wondering, when you’re looking at addressing and mitigating churn, how are you tracking that?
Maribeth Duggins: And how are you showing, like the outcome of the work that you’re doing there? Yeah, so one of the ways that we track that, back to the text analytics is that we created our text topics so they align more with our business functions. And so in that way we have a group that’s accountable without pointing fingers, where we just say, because of this, it’s assigned to you.
So whether that’s through an alert, the other way that we create that accountability is that we have, for all 6,000 of those accounts, we have a, an account manager, whether it’s field sales or inside sales or the owner of that piece of the business. There is a person assigned to every single parent account number, and whether they have to route it to someone from there or not, there is someone who’s responsible for that.
And if the threshold goes above five days, then it comes to [00:25:00] me. But that creates some accountability because the truth is, we’re not trying to put anyone under the bus and say your account is falling behind, but it’s truly. To help you do your job better. So there hasn’t been a lot of pushback from that standpoint, but I would say that accountability based on, who’s in charge of managing the account and getting them to buy in on how that matches up before we even put it in there.
So they’ve said, yes, these are my accounts, and so now it’s in there and it’s matched up, and we try and update that on a quarterly basis.
Q+A (6): And then in terms of reporting, like closing the loop like how much. Risk you mitigated.
Maribeth Duggins: Yeah. That’s something because this is so new, I would, I hope to be able to report on that risk mitigation.
But in terms of closing the loop, we do have a five day SLA with our teams where they have agreed to within five business days to close the loop. With our practices. And so that’s another thing that we’ve got in this account risk model is, the engagement. So how many of our customers even took the survey?
So that’s another point where we see if they’re engaged or not. Did they even give us feedback and then, did we close the loop? That’s something that can [00:26:00] help with that as well. So that’s all tracked in the tool. That’s one of the signals as well.
Q+A (7): Hi. Thank you so much for a great presentation. It’s really powerful what you’re doing and the influence you’re able to drive in your organization.
It sounds like I walked in a little bit late, so sorry about that. But I would love to hear how you went about identifying the 120 plus signals, and what the process you went through to do that.
Maribeth Duggins: Yeah. I’ll be real honest, it’s just the data that I could get my hands on. I was willing to get my hands on anything that we knew about customer, as long as we had that parent account number.
And honestly, that’s why at first we couldn’t pull in our post order. Data because it was run through a different platform, a different survey vendor, Qualtrics. And so we did, I didn’t know who they were. I had all the feedback, but I couldn’t tie it to anything. And so finally we were able to tie that back at the parent account level.
And so that 120. Is just the data sets we could get ahold of, and I would love to add more to that. Plus, those signals that we created out of the data that we had, the ones that we made up on our own, that we thought would be interesting correlations. All right, I’m getting a flashing red [00:27:00] light and a 0 0 0 up here, but I really enjoyed the time with you all and hope to chat with you later.
Thank you.