Spencer Thomas: [00:00:00] My name is Spencer Thomas. I’m a digital experience advisor at Medallia. So excited to have everybody here today. First, why are we here? Not some big existential question, but why is this digital experience analytics platform? Why are we talking about digital? Because in 2025, all experiences are influenced by digital in some way.
Everything you go to, every event you go to, you came to this experience conference was influenced in digital in some way. You found out about today’s session through an app. Um, you go through the airport, you might be using your app, your phone to get in. You’re signing up for something, you’re online, you’re purchasing something.
That’s a website experience. It’s setting you up for a proper experience, but influenced and supplemented by the digital experience. Kind of to, to set the stakes here. So over the last couple decades, there’s been a democratization of information access. So you could think. 20 years ago or so, going on the computer, going on the internet was like an activity.
You might have had a computer room or something like that. So I know we had a nineties themed party last night. That was a [00:01:00] very nineties thing to do, but today there’s 5.5 billion people with access to the internet. So the vast majority of, uh, people in the world accessing, uh, all this information. But as they’re doing that, they’re throwing off tons of signals.
Every page that they go to, every scroll they make, every view they they have is some sort of signal that could be captured. By a platform. Additionally, life is lived digitally. So many adults, 41% of adults indicate that they’re online, almost constantly, constantly available, constantly getting pinged. What this means for you though is that your customers are always available to you.
Um, both a blessing and a curse, always there, but you always need to make sure that you have your vest foot forward, uh, with them. So the impact on cx, so 51% of customers stopped being a customer of a company because of too many issues on their website or app. So a vast majority of them. Additionally, we see a negative 20 NPS score for users that experienced some sort of issue online versus a plus 28 [00:02:00] score for those who did not.
So a 48 point swing for people that had some sort of issue online, and we’ll get into some of the importance of this in just a moment. You might have a digital feedback program set up to capture that little bubble. What is happening? What about why is it happening? What about everybody else that isn’t leaving you?
Feedback all these extra signals. So we’ve been hearing a lot about going beyond surveys. Surveys are not enough. Well, yes, we see this, uh, in the digital space as well. Survey fatigue is apparent. There’s a decline in the quality of feedback sometimes. And also 52% of users who experience an issue online are not likely to leave you feedback at all.
They’re just gonna have that issue abandoned. Go do something else. That’s important, especially if there’s a large percentage of people that are going to drop off and not be your customer anymore if you do have that kind of issue. So what you’re gonna find is you might see in some feedback, I’m constantly asked to authenticate, reset my password.
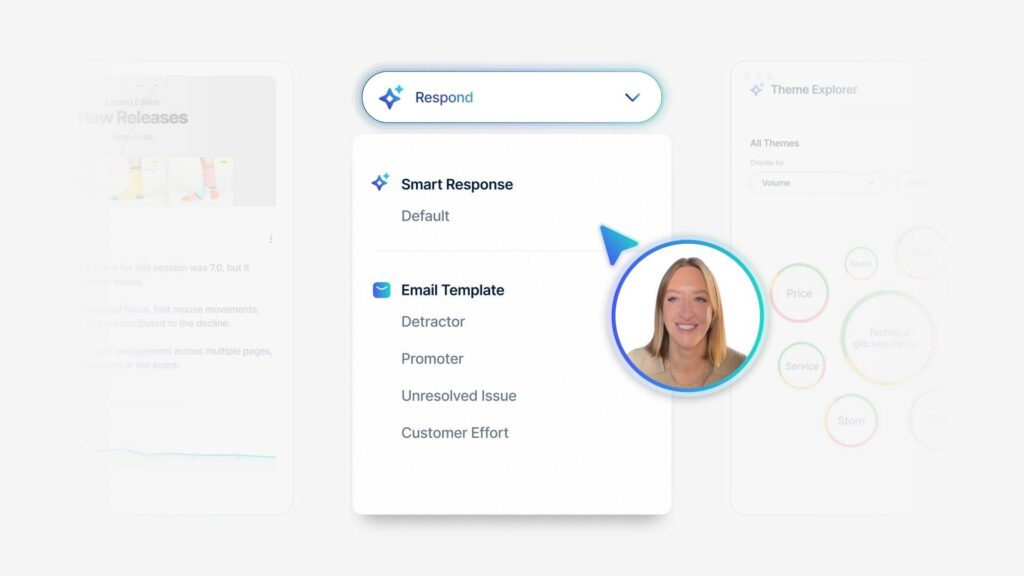
Why can’t you make this easy for me? So this is nice when somebody actually tells you about this in feedback because the vast majority of people are going to [00:03:00] find another deal somewhere else, but not telling you about it altogether. So what Medallia’s Digital Experience Analytics allows you to do is literally experience your brand as your customers do, and allows you to tell stories about what customers are doing on your websites and apps.
So to get into today’s agenda, we’re gonna break it down into three categories. First, making sense of digital data. So all those signals that people are throwing off on their websites and apps, all those clicks, all those scrolls. How do we make sense of all that in a systematic way? How can we validate this information against your existing data, your analytic systems, your CX data?
Then we’ll talk about driving action. What actions can we take to keep people on the optimal path, on the conversion path? So what we’re gonna do, we’re gonna kinda have a little story and a narrative through this. So if you recognize this image, uh, it’s from 2010s Tron legacy. So when I was thinking about putting this presentation together, I was thinking about how do we sort of humanize this?
Well, this is kind of a physical representation of, uh, human form in the digital space. So we’re gonna follow our main character, [00:04:00] Sam Flynn, as he embarks upon a digital journey to find his father. We have a goal for today’s session, a conversion goal, if you will. We’re gonna find Kevin Flynn and Escape the Grid.
We have a couple characters to introduce here. Our two antagonists on the left, Rensler and Clue, very color coded. The red guys bad, those that are kind of seeking to cause a lot of frustration issues, things like that online. And then we have our good guys, Cora, offering realtime support and Kevin Flynn, our system creator.
We’ll have, uh, a few, uh, check-ins with this story as we go through, but again, our goal for today’s session. Find Kevin Flynn and escape the grid, and we’re gonna use Medallia’s Digital Experience Analytics to do just that. So first, how do we make sense of all the digital data that’s thrown off from all your users on websites, apps?
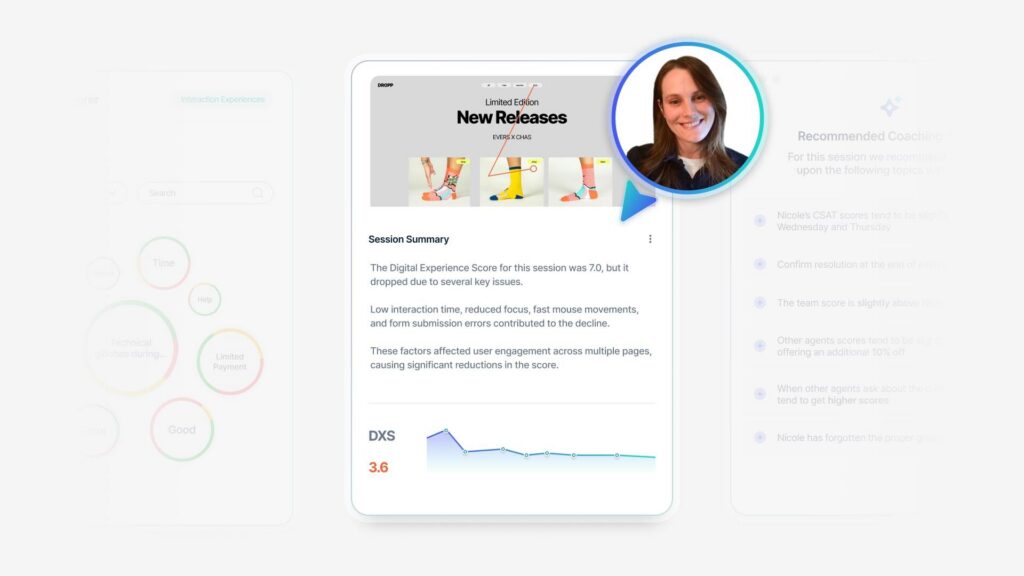
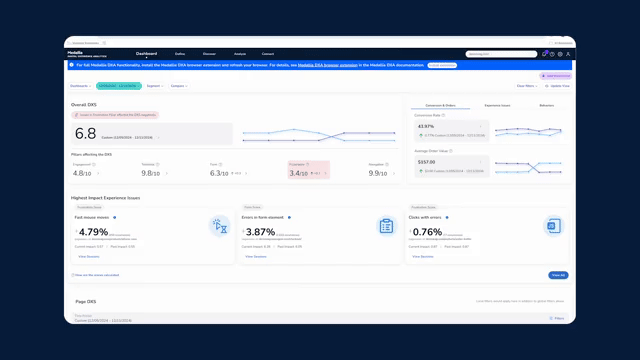
Again, beyond surveys. What else can we do? So first thing is to come up with a score of framework for scoring sessions at scale. What Medallia has is this digital experience score, kind of a roll of score. The 10 out of 10 would be, uh, fully optimal. [00:05:00] Basically looking at do users, like what does good look like?
Um, when you get to the checkout, what do those sessions look like when people abandon the checkout, what do those sessions look like? And coming up with a systematic way to score all of these sessions at scale so that we can then figure out what types of elements lead to a successful outcome for users.
On the other side of this, we have kind of some frustration type behaviors when people cannot figure something out, when they can’t purchase something. What we see in this gif here is somebody trying to add an item to a cart, clicking it repeatedly over and over again, scrolling, moving their mouse around.
These types of frustration actions, again, are captured for all of your web sessions. So if somebody is unable to complete a purpose and doesn’t tell you about it, as we saw earlier, well over half of people are not going to tell you If they have some sort of issue, we can understand why. First thing we look at, there’s a number of different signals that we’re capturing here.
So things like interaction time. How long did it take somebody to read a page? If it’s a long content page, are they spending an [00:06:00] adequate amount of time on it? There’s some technical things that are happening in the background page, readiness, um, JavaScript errors, things like this. Some of the frustration behaviors that are captured, unresponsive clicks, things like that.
Um, rapid Scrolls, uh, maybe moving your phone from side to side, rage clicking, tap, tap, tap, tap. The, all these things are a sort of digital body language that somebody could have. And all of those types of actions and behaviors are captured by, uh, digital experience analytics Additionally, and so many is, um, inputting information into a form.
So something that we see pretty commonly is when you’re putting your, uh, name credit card information in like that, you might have a new address. I don’t know if you’ve ever experienced this before, where you’re trying to type in an address. It doesn’t come up on the pick list. You’re kind of stuck. What do you do?
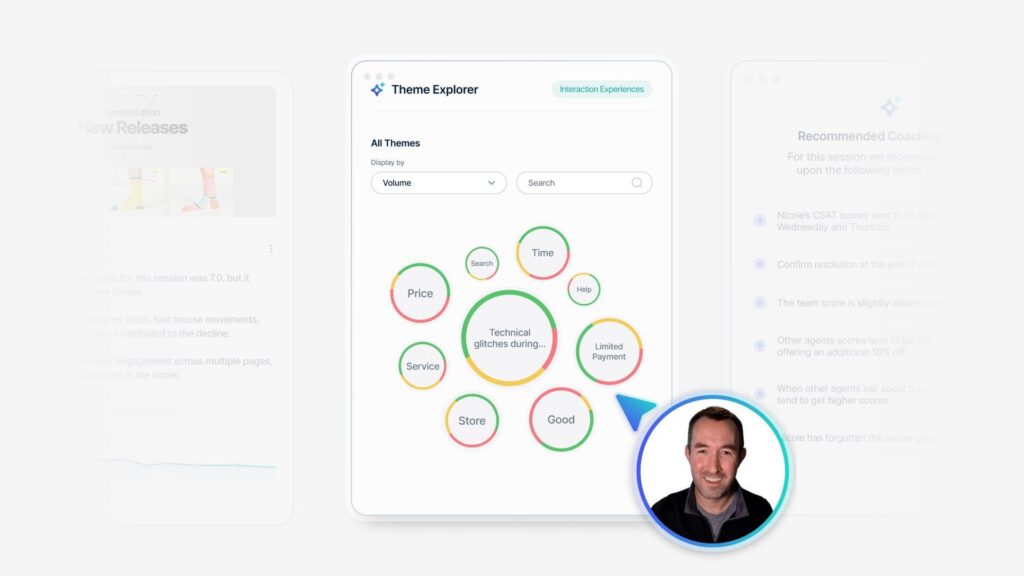
And then screen looping, kind of a navigation behavior. If you’re going from page A to B2C, back to A, B, C, that type of information is captured as well. So all these are organized into these various pillars. Um, we have an engagement pillar, technical frustration form. Experience in navigation. Engagement is more of your [00:07:00] content focused.
So are people actually paying attention to the content on the page? We have the technical, um, so the things that are happening in the background, different errors, things like that that could be captured, frustration where somebody might be moving their mouse around, scrolling quickly, uh, things like that.
Um, rapid clicks mentioned that before. Again, all of these are different, uh, events and things like that that can be captured. Form, experience, inputing information into a form navigation and how you go from page to page, whether you’re looping, things like that. So all this information is captured at three levels at the session level.
Page level in real time. The session is the beginning to end user session. So you enter a website, you convert, you abandon, but that is kind of captured in one session. The page level is more of an aggregate type information, so of the overall number of users that visited a specific page, all that data is captured and of summarized for that page.
And then many of these elements are also available in real time. So when these things happen, when this rapid [00:08:00] scroll happens, when this rage clicking happens. There is an event that could be pushed to a website’s data layer to then influence some action. We’ll have some ideas about that in just a moment here.
So this, I’m not a robot. This is something that we all face kind of proving who you are, authenticating and so on. So as we check back into our story, this is actually exactly what Sam Flynn is encountering, trying to improve that he is a user, not just. Some program stuck on the grid, but really what it amounts to is he’s running from spot to spot.
Kinda lost, confused, so you can think of if somebody is lost or confused on your website, would it look like this? This is kind of a representation of what that could look like. Jumping from spot to spot, falling down. Then he ends up against his final challenger here, uh, with something called discords, where again, it’s like.
I wanna do is log in. All I wanna do is pay something. I’m trying to buy something from you. I’m trying to be your customer. You’re making it as challenging as possible. I’m having to do back flips over this. Why can’t you make it easy for me? So just kind of a fun representation of what that could look like.
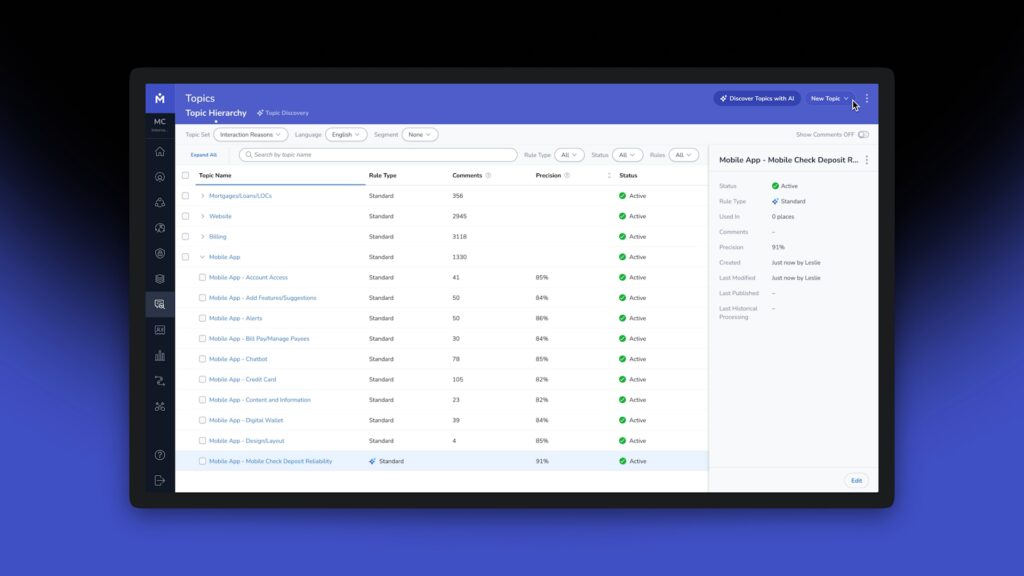
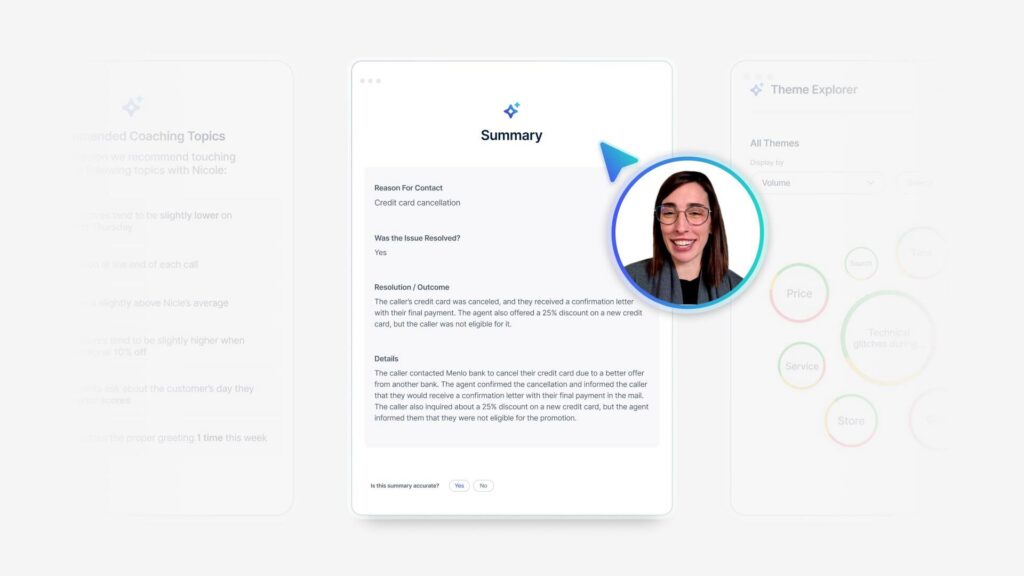
Making sense and [00:09:00] validating all these scores and signals against some existing data. So this is something that I will discuss in our next section here. So different validation strategies against all of these experience signals that we’re capturing. First thing is to actually watch the session replay and the session summary itself.
So we have in the digital experience analytics platform today is every session that’s captured, you can get a visual representation of what’s happening. You can see where the user went, where they moved their mouse, what things they clicked on. All this information also is masked. So if there’s anything personal him, uh, credit card information, all that.
Uh, won’t be seen. It’ll also be accompanied now by a session summary where it then describes, you know, in about a paragraph and some points under that, uh, what the user did, where they went, things like that. We may be seeing and hearing about digital issues and other forms of feedback. Maybe your digital feedback, maybe your call center feedback.
People talking about frequent glit crashes. I’m constantly being logged out, so I had to call you having to call over something like logging in kind of a expensive task. Why can’t you make it easier for them in that moment? But. If your call center’s [00:10:00] dealing with issues like this, there’s definitely a some area for opportunity.
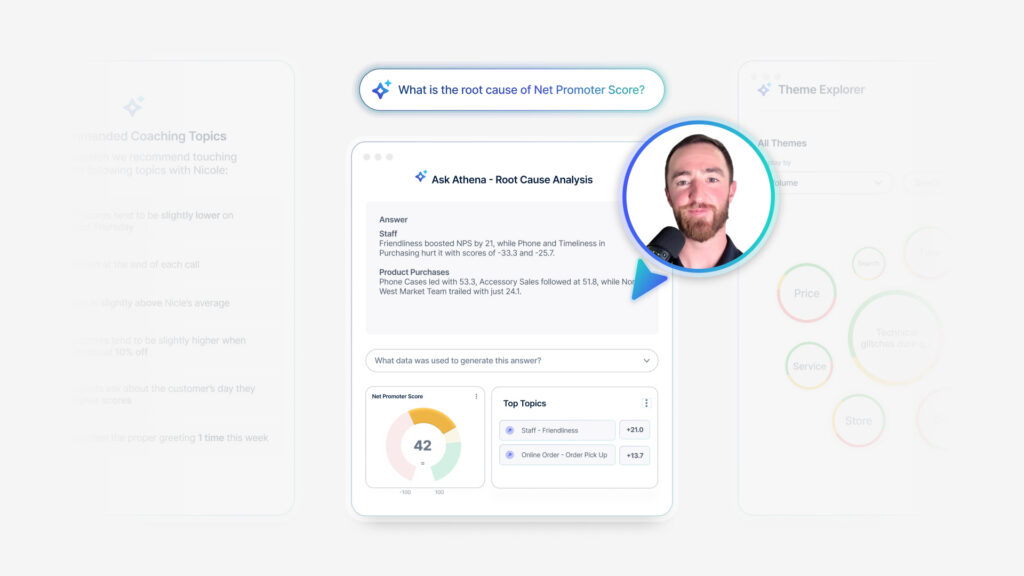
Then sometimes you just run into inconclusive data where you’re getting your web analytics team is saying, we’re seeing a drop in conversions. You check your survey data, all customers still indicate that they’re happy with that. So what could we do? Well in those types of cases, we can kind of ask in real time, maybe prompt a survey, prompt a live chat.
So in this case, we’re trying to stay on the optimal conversion path. We have our bad guys, our frustration trying to get in our way, but we have this realtime support, Hey, happy to help you. So, you know, keep us on the, uh, the conversion path, some other validation strategies. So, uh, we’re gonna go into four different quadrants here, but this is kind of comparing your digital feedback data and your XS scores, where you might have a kind of the, the tens or the, the highest scores where it’s both people are, it’s telling you that they’re happy in feedback surveys.
And also their digital experience score is positive. So this is kind of that [00:11:00] positive cohort You might have those that have a positive digital score, but a negative experience. You know, the reason that they’re leaving a negative score might not have to do with whether or not the website loaded quickly, whether they would define the information they want, maybe the information they wanted, just, you know, didn’t explain it well enough.
Or they had some other expectations set outside of the digital experience, but it wasn’t the digital experience itself that kind of gave them a bad score. The warning quadrant, this is one, is pretty important when we consider how many people will stop being a customer of a brand due to a poor digital experience.
These people are still telling you that, that they’re happy in surveys, but the underlying technicals, the stuff that we’re collecting from DXA is saying that there’s some problems here. There might be some technical issues that the user is just overlooking, but they at a later date could cease to be a customer if those issues persist.
And then the poor quadrant, those that are both having a poor digital experience and giving you poor feedback as well. So you know, something to, you know, maybe [00:12:00] you’re lucky to continue to get feedback from this group, but you’re both not meeting expectations for your offering nor your website performance.
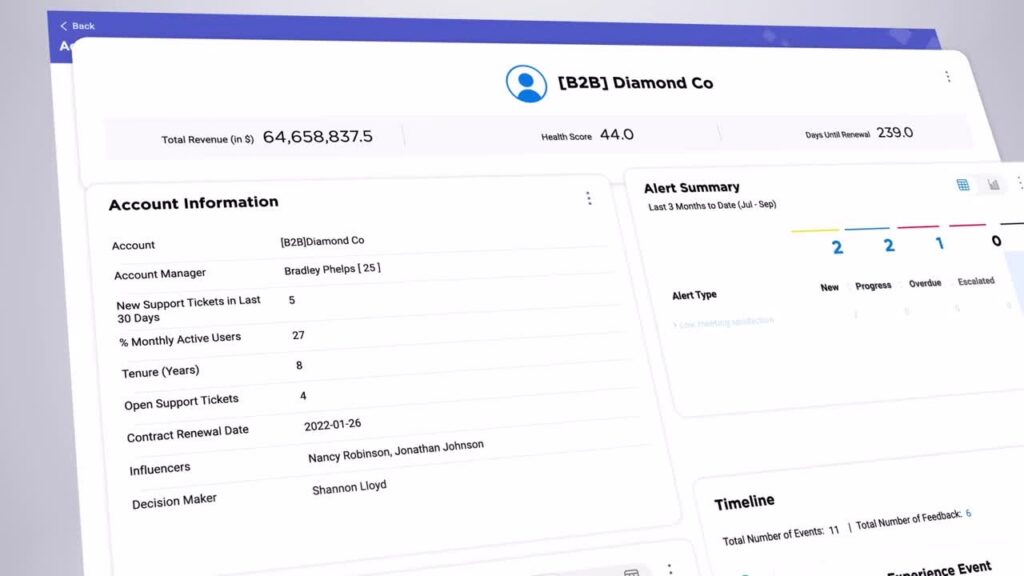
Something that might be familiar to you. This is kinda one of my favorite reports, uh, within Medallia, kind of a ranker report, both ranking a URL by two categories, page helpfulness. So the yes no type survey. How helpful was this page and the page dx s score, uh, which is aggregation. So what we have in this case is the contact us page is both seen as not helpful and has a lower page.
DX s. Could be due to some frustration events, people rapid scrolling, looking for information that they can’t find. So how do we drive action based on all this data? So when we check back into the grid, we find a chaotic digital experience programs, fighting programs, everybody battling a lot of frustration, a lot of technical issues, people trying to figure it out, but it’s really not going well.
But good news is if you’ve reached the first part of our goal, we found Kevin [00:13:00] Flynn. Now our next step is to escape the grid. So how do we do this? First, we’re going to, uh, try to increase customer loyalty By closing the silent Loop, we’re going to come up with some real time strategies with a chatter callback functionality, and then we can optimize user experience with a find and fix repeatable methodology.
So closing the silent loop, we can kind of set this up. What would this look like over the course of a work week? So we come in Monday morning. And we see there’s a number of alerts around some conversion issues on a key flow. What we’re able to do is see these issues from the customer point of view with session replays, with session summaries.
We understand what’s happening. Why is it happening? So then we’re able to then, uh, dive into another system, our Adobe analytics system to then figure out how many people are experiencing this same type of issue. So, you know, you might have an alert for a handful of people. We check the traffic. Okay. This is impacting maybe a few thousand for a key flow.
It’s not fully impacting. We still see some people going through, but we’re able to capture [00:14:00] because in our Adobe system, there’s some user information available to us, uh, who these people are that are having this type of issue. And due to kind of the a friendly developer, we’re able to implement a fix pretty quickly.
And then on Wednesday we’re able to then inform those people that had this issue. This is people that did not leave us feedback about it, but because they encountered a specific error at a specific point, we were able to capture their information. So this type of methodology, um, in some cases can save say like $2 million around sales conversions, activation, account opening.
So again, it’s how much are you saving by improving how quickly you’re able to fi find and fix some of these types of issues. So again, this is like closing the silent loop. Those that are not necessarily leaving you feedback, but you’re fixing it for everybody. And then just a proactive outreach. Hey, saw you were in a cohort of people that had some issue, wanted to let you know it was fixed.
You know, kind of just going outta your way to say, Hey, we saw you, we heard you. Another one is a triggered callback. So we mentioned that a contact us, uh, page a little bit earlier where this is [00:15:00] often where users are seeking to reach out to you. So there’s, you know, something to be said about. You know, we want to deflect calls within the digital channel, but in some cases it’s just appropriate.
Let’s make it as easy as possible for these people. These people are probably calling us anyway. They’re already looking for our information, so let’s prompt a callback to essentially allow them to wait on a virtual hold. We’ll call them when we’re ready, or they can schedule a specific time. This most benefits the customer because they don’t have to wait on hold to re-explain their issue and it benefits the employee on the other side ’cause they have some context about.
User was frustrated and is online is looking for help. Okay, that makes that first minute or two, that phone call a bit easier. Hey, I saw you were having some problems. How can I help you? It’s working as designed. This is something that you may encounter where you find an issue. You think there’s an issue.
Your product team just says there is no issue. There’s no technical error. It is working as intended. Well, in this case, we’re observing that there’s a drop in the amount of, uh, volume in our login flow. And so, you know, take a look at his picture [00:16:00] real quick. What’s wrong with it? So through some real time behavior monitoring, we saw an increase in frustration on this specific page.
And what happened was that cookie policy is covering the login button. So yes, you can, I. X out of it, you can move it. But this cookie policy blocking the login button. Yes. Technically working as design. No real error, but you’re able to then articulate. No, we actually see a drop in people. We see an increase in frustration on this specific page.
So let’s implement a fix, get a little bit lower, and then in that case we’re able to see our login volumes return. So through a realtime listening ecosystem, we might see. Say 1500 visitors in a day, dropping off a major application flow, and you’re able to discover why is this happening in a matter of hours instead of maybe a matter of weeks kind of looking behind and saying, oh, there’s a drop in volume over the last week or so.
Well, if we can articulate an increase in frustration over the course of a day, something like that, [00:17:00] then that saves us time. So you might be able to solve one root cause issue in a single day, saving $50,000, but then if you. Kind of expand this over the course of an entire year, we could then see savings in millions, especially if you have kind of an overall culture, let’s say 300 plus people logging in using this type of experience, analytics data on a regular basis.
So in the end, we’ve been able to find our goal, escape the grid. We’re able to articulate all the different signals, compare it against our existing. TX data and existing analytics data in the end. Take real time action so we can open up for questions. Discussion.
Q+A: Hi. I was a little surprised by the 52% of people that experience a issue don’t provide feedback.
Is that specific to digital or is that just in general experience, and is that coming from data? From Medallia customers.
Spencer Thomas: Yeah, it’s the Medallia research and it’s [00:18:00] specific to digital issues, uh, for our, the research that we did.
Q+A: So if I’m seeing technical issues actually coming through feedback that could be much larger.
Spencer Thomas: Yes, definitely. Yeah. So it’s if you’re experiencing that issue and ops to leave feedback, it might be because there was an always on there. Maybe you got an intercept or something at the same time, but. You would literally have to go outta your way to do that when you already had a problem. So yeah, if you’re actually seeing somebody tell you about it, then it’s,
Q+A: I’m actually gonna use that stat with my stakeholders where, you know, it’s, it’s so little in the feedback, right?
You don’t really get a lot of login, um, feedback through the comments or things around technical issues a lot. It’s, it’s other things. So that might help me in kind of. I would into that a little bit deeper to see how big that issue is. Yeah. I would encourage you to Adobe data too. Yeah.
Spencer Thomas: I would encourage you to look to, in your contact center survey responses as well.
’cause people will tell you in those places and it’s like, wait, you’re speaking to somebody about this, you know, you can’t sign up for something or, [00:19:00] yeah. So you can hear people describe it verbatim, what they’re seeing.
Q+A (2): Hi. Thank you so much for walking us all through DXA. Um, I just had a quick question about the engagement score and how are you all defining what engagement looks like, because it could probably be different across industries and businesses, but, uh, just wanted to get a.
General understanding of that part of the DXA. So it’s, or DXS,
Spencer Thomas: it’s a part of, it’s a standardized model, so it doesn’t change based on that. It’s the same for everybody. And effectively it looks at things like, how long are you spending on the website? Are you focused on it? So are you scrolling so quickly that there’s no way you could actually be reading the content?
It also adjusts dynamically due to this, um, length of the page itself. So a longer page we would expect somebody to spend more time on. So if they’re spending. Less time on it versus a short page, but they’re going quickly doing what they’re intended to do. You would still see like a positive score in that way.
So focus time, are they scrolling? [00:20:00] Uh, sometimes there’s like mouse reading activity where you can tell if somebody, um, is moving their mouse under. That indicates they’re fairly. Um, engaged on the content itself changes as well for a mobile, uh, web and mobile app. Smaller screen. Again, kinda that slower scroll means you’re reading the content on it versus if you’re just kind of whipping through it.
Um, so yeah, in that case it’s a standardized score for everybody, but kind of factors in all those focus and, uh, scroll, uh, type activities.
Q+A (2): So I get. Sorry to follow up question to that. Uh, so if you’re on like a product list page for example, and you’re scrolling through and you’re not finding what you’re looking for and potentially going and clicking on something else, would we see.
In the DXS or the, the scoring like engagement would potentially be up, but then there’s another piece where maybe there’s frustration because they’re not finding what they’re looking for. Like how does, how do we get all of that into one score?
Spencer Thomas: Yeah. So the, the aggregate score is the DXS score that pulls it all together, and then you get each pillar that rolls up.
So then you [00:21:00] understand which pillar specifically impacted that score. Most, so specific reports in DXA where you could be looking at a product page or a po uh, group of product pages. Where it has all those scores that roll up for each, as well as the specific events that are tied to each of those pillar scores.
You’ll be able to see rapid scroll 1500 over the past week along with the specific sessions for it. And then you can see for each behavior that’s captured a total count of it and the impact that it has against that overall DXS score. So you’ll both see the score at the high level as well as all the things that break down in a score in that type of report.
Q+A (2): One more question. Last one, I promise. No worries. And so do you group those sessions together based on the pages? Like how, I guess, how should we be thinking about how to use this DXS with, you know, product partners who are specifically figure focused on pages and then other partners who probably care about the end-to-end journey?
Spencer Thomas: Yeah, the short answer is you can do it however you want to. Um, [00:22:00] the long answer is, it, it depends specifically on the use case. So if you, if that’s how people are organized by pages or groups of pages, that’s an easy way to organize the data. But if it’s organized by journey, somebody going through an entire flow, you can organize it in that way.
Or if it’s going through a journey, but only specific types of users and you’re able to capture some sort of parameter or data element for those types of users, you could segment it in that way as well.
Q+A (3): In terms of like benchmarking or, or basically what we’re experiencing is our pillar scores and our DXS scores.
Everyone thinks they’re really good ’cause they’re above seven. Yep. Um, but when you actually, like we know our websites aren’t that good, uh, or they have improvement opportunities, maybe a better way to say it. Um, so some of the underlying behaviors that we see in DXS show a lot of the things that you mentioned, but how do you kind of, um, balance that with the, with the high scores and get the product owners to kind of dig deeper and continuously improve?
Spencer Thomas: Yeah, so with the DXS scores, there’s a much lower variance I’ve seen where. [00:23:00] The upper sevens might be good and the lower sevens might be bad. Um, so sometimes what I would suggest is in DXA itself, you can set up filters and segments based on the digital feedback. So that’s part of the up, like the, uh, validation strategy.
So you look at the people that are leaving me eights or nines and tens, what does their score tend to be? Yeah, and then the people that are leaving me zeros through six is what does their score tend to be? So somebody’s opinion of a brand is not necessarily influenced by how quickly a webpage load, but they might be moving their mouse a little bit more.
It’s all very nuanced, so I do think that saying it’s above seven, it’s good. Well, it might be 7.1 to 7.6 for the actual variances, and it’s those, anything above 7.6 is good and everything. 7.1 is. It is bad. The range itself depends on the customer type, but that’s the most common one I see is just, uh, kind of in that seven range, um, is how [00:24:00] things are scored.
So, uh, but yeah, again, validate against something like digital feedback and it’ll give you a good indicator.
Room Host: Thank you guys for coming out. If you don’t mind, in the middle of the table is a QR code, if you can scan that and leave your feedback, that’d be great. Thank you.
Spencer Thomas: Thank you bud.