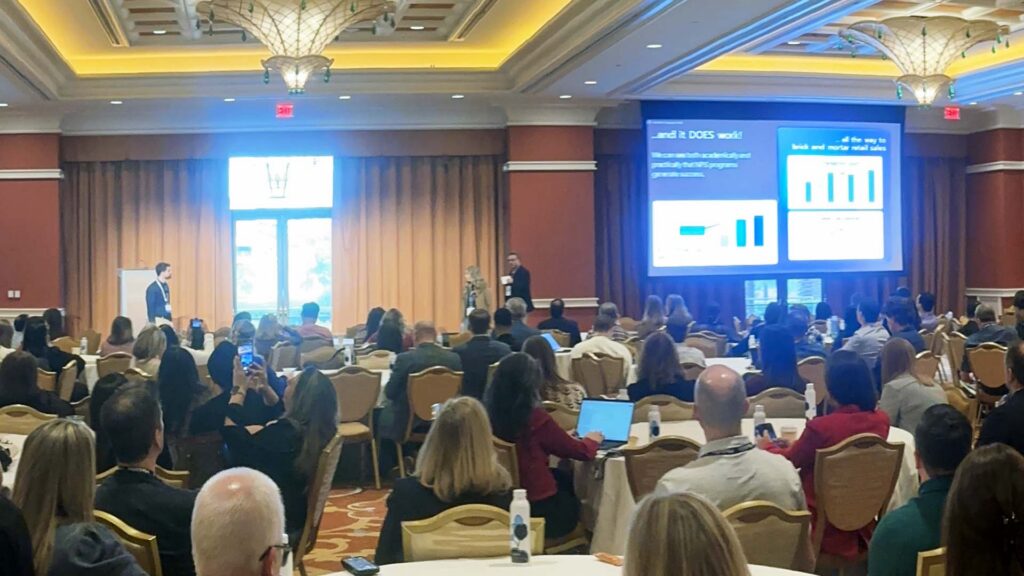
Tami Salmi: [00:00:00] Just want to welcome everyone. Today what we are gonna be talking about is this thing called NPS for what feels like forever, right? The CX industry has been focused on this one number, but NPS is powerful and it’s not gonna be the villain of the story today, but we wanna talk about going beyond NPS, not to replace it, but to understand what our customers are really telling us.
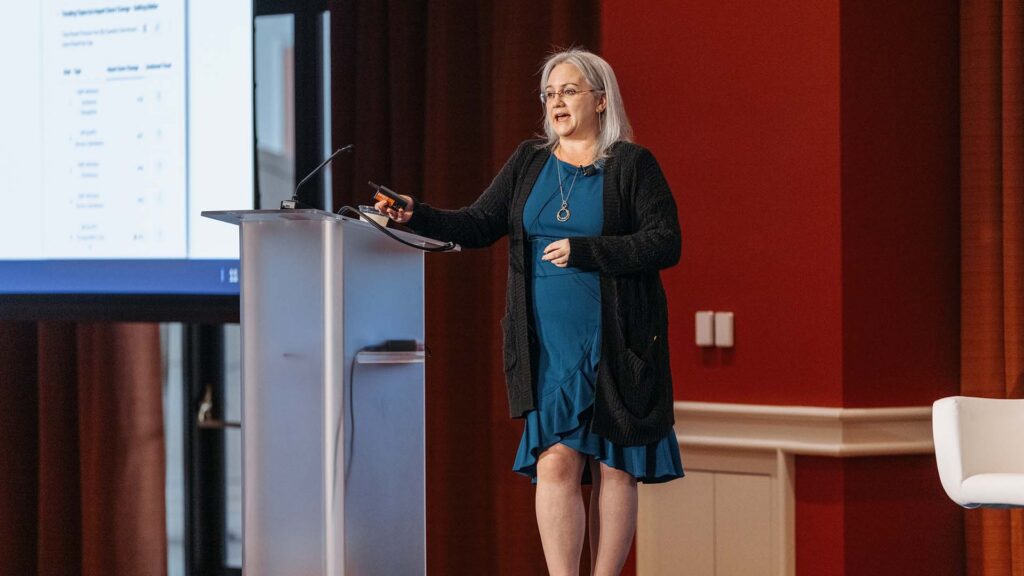
Some quick introductions. My name is Tami Salmi. I lead Medallia’s research Services team. I’m joined here today by my colleague, Jason.
Jason Reilly: Hi everybody. My name’s Jason Reilly and I’m part of Medallia’s strategy and analytics team. And we are joined today by Austin.
Austin Evangelista: Hello everyone. I’m Austin Evangelista
I’ve come from Trulieve and I’m our senior
customer Insights manager.
Tami Salmi: Perfect. We are so excited to have Austin here today because he’s gonna help ground our conversation in real lived experiences and not just theory. So [00:01:00] where are we headed? First, we’re gonna answer this really simple question, what is NPS telling us?
But also, what is it not? Next, we’re gonna look at how CX programs start to lose clarity as they. Mature. And then we’re gonna talk about how leading teams are able to connect different signals to tell a very cohesive story. And lastly, and this is my most favorite part, is what happens when we stopped chasing scores and actually start shaping behaviors Because I am sure everyone in this room does not get excited to wake up in the morning and manage a number.
So I wanna start with this question now. Maybe this is something you’ve heard before. Maybe you’ve even been the one asking it with a little bit of panic in your voice, right? The reality is this is the type of question that can send entire teams into a frenzy. We’re looking at our [00:02:00] data. The scores are going up quarter over quarter, but the actual numbers of our sales don’t change.
Now I want you to raise your hand. If you’ve ever been in a meeting that’s focused entirely on your NPS score,
oh God,
now keep your hand up if your bonus is tied to that NPS score, and this gives you a little PTSD. No, I’m kidding. I’m kidding. But the reality is, this is the perfect example of a really common problem, and we call that problem the score watching trap.
This is that endless cycle where we’re just chasing these one or two point swings in our NPS score. Where literally the anxiety outweighs the actual insight that we’re getting from our data. Now, CX programs focus on scores, and when scores are good, it’s easy to feel like everything is working. But good scores don’t always translate to growth.
They don’t always translate to loyalty or better outcomes, [00:03:00] so we have to figure out how to get out of this trap. But to do that, it’s probably best to understand how we all fell into it in the first place. So NPS became king for some really, really good reasons. First, it’s brilliantly simple to understand, right?
Would you recommend us even your cousin Larry can answer that question? We know it’s used everywhere on the planet. Brilliantly simple to understand, and the reality is it gives us that common language to unite in the boardroom. People know how to talk about our customers. I’m gonna turn it over to Jason who’s gonna tell us what happens when we start to dig into the data.
Jason Reilly: Thank you, Tammy. So why is it King, right? Why is NPS king? Because objectively we can see it works, right? Whether we’re looking at spend, visits, transactions, we know that when promoters are happy, they spend more, they visit more, they conduct more [00:04:00] transactions. When someone’s a detractor. They do less. They disappear even.
But that’s the heart of the problem. That’s the question that we want to ask. This is the critical question. Why, right? When we have a single score, we have blind spots, we don’t see the whole picture. We don’t necessarily have everything that matters, and sometimes it’s even distracting. Some of you might have heard of Good Heart’s law.
Has anyone heard of that? Actually super quick Goodheart’s Law. Okay, so Goodheart’s Law states that when a measure becomes a target, it ceases to be a useful measure. The reason is, is that when we’re all chasing a single number, right, when we’re doing that score watching trap, when we’re all in those meetings, we’re looking at our NPS scores and is tied to our bonus, we will do whatever it takes to get that single number up, no matter what the consequences are to other aspects of our [00:05:00] business.
When one number fails, you know this is the limit of NPS, right? This is why it can struggle. This is why even though it’s king, even though it can work, it still misses 72. This is a great number, right? How many of you guys would like to see 72 on your NPS dashboards? Sure. A bunch of you. Cool. That’s great.
Why is it 72? What’s happening here? You have a seven and a two up on this monitor, right? What’s actually happening? Where are the friction points? What went really well? Where’s the emotional context? None of that’s on this screen, right? None of that’s gonna be on a dashboard, which just shows the number 72.
Now, I don’t want you just to hear it from me. I want you to hear it from somebody who lives this every day. I’m gonna turn it over to Austin.
Austin Evangelista: Thank you. So as a retail business, we look at NPS on a store by store basis. And this example kind of showcases exactly when that number started to fail us and when bringing in additional [00:06:00] information shown a lot of extra light.
So we were taking a look at. Five different stores across our business, and all of which had declining NPS scores. It was starting to raise flags. We were very concerned. We brought each other together with a conversation and started saying, what should we do to start fixing these things? How can we start improving these scores?
We got action plans together. We got teams aligned, and week over week, as we started to look at that NPS number, we started to see increases. Incrementally, we started to see positive growth, so we got very excited about this. We started to feel very positively about the effort that was made by our teams, but as we took a little bit of a look closer is where we discovered that we were failing ourselves with just one number by taking a look at the amount of customers that were shopping at those stores.
It wasn’t that our net promoter score was improving because of more promoters, it’s because detractors stopped shopping with us. Had we not brought in that extra piece of data, we would’ve never seen that ’cause all other numbers were pointing to a positive result.
Tami Salmi: This is so great and this is [00:07:00] why we can’t just rely on NPS.
And so the first step out of our score watching Trap is we very simply have to broaden our tool kit Now. Let’s start with what NPS does really well, right? This is our loyalty metric. It answers that big question. Would you choose us again, giving us that overall relationship that customers have with our brand?
Now, quick nuance here, but this is important. Transactional NPS uses the same question, but the difference is it’s asking is this specific moment. Strengthening or weakening the relationship with our brand. And that difference is big. The reason why, if I put it simply, if I asked you how was dinner with your wife last night, you might have a very different answer if I asked you, how’s your marriage?
Right? So the reality is we have to treat these differently. [00:08:00] Now. Next we have overall satisfaction, customer satisfaction. Here we’re obviously looking at that single interaction and saying, Hey, how satisfied are you? Another way we look at emotion is also by going beyond that score that someone gave us and start to look at the comments.
What are they telling us about? More importantly, how are they saying it? Is it positive? Is it negative? Is it neutral in sentiment? Another key one here, customer effort score. This is that. How easy was it for us to solve your problem? What I love about these measures, and we see this a lot in the contact center space, is it’s still related to experience, but what’s nice is we start to shift and look at outcomes.
Are we delivering? And lastly, we have trust and confidence. Now, these are used really widely. In industries like healthcare B2B, we also see it in utilities, financial services, where [00:09:00] these types of things, safety, security, reliability are so important. They’re almost non-negotiable for people. And again, I think sometimes we forget that there are actually humans that are going through these experiences and we don’t necessarily always measure what happened to them.
But the point of this. Is that one number cannot do all the jobs, but we’re not here today to tell you that. You just have to go replace NPS and swap it with something else. But this also isn’t a trip to target where we are gonna go pick up five things we don’t need. We have to be really intentional. So I’m gonna turn it over to Jason.
He’s gonna tell you why. Cramming all of these into one survey could actually do more harm than good.
Jason Reilly: So Tammy said it right at the very beginning. They’re friends, not roommates. Alright. Fastest way to destroy a friendship, become roommates. Okay? I, I’m just telling you my college experience. All right, [00:10:00] so what we want to do is we wanna be focused, right?
More is not necessarily better if more is shoved into one survey. Right. It’s good to want some of these items on here, right? In fact, technically speaking, you could even want all of them. You could make that target run, but you need to know why you’re doing it. You need to do this with intent. You need to do this with purpose, right?
You don’t wanna do it all at once. Why? Alright. Classic call center survey. I’m sure you’ve all seen this, you’ve all experienced it, you’ve all had it. You’re being asked, how easy was it to resolve your issue today? Classic effort score type question, right? Later on in the survey, maybe you get a couple, you know, driver questions.
You know, was the agent knowledgeable? Were they able to provide you a solution? Whatever, right? Finally, you get NPS. How likely are do you re recommend our brand overall? This is a problem because [00:11:00] when your customer is answering this, they’re going to want to be consistent, right? So they’re going, there’s going to be artificial correlation.
If they give you a CES score of nine or 10, they’re not going to want to give you an MPS score or LTR score that’s a four or five. They’re not going to feel that that’s accurate or fair. We are artificially forcing correlation through the psychology of how this person is going to respond to the survey questions.
We also are looking at maybe they did really like us. They had one bad experience. It shaded everything, right? So we’re trying now to say, okay, we want MPS in here, but we want it to reflect the entire relationship overall, and we’re doing it based off this one tiny little transaction. Is that fair? Think about a banking call center, right?
A bank call center [00:12:00] where you might have multiple interactions. You love their website, you love. Their branch. You love your banker who helped you get a car loan at a really good rate, whatever. You’ve had all these great experiences, but as far as the bank is concerned, you hate them because you had one bad call center experience.
You’re not, they’re not seeing the whole picture. And finally, because of the artificial correlation, because NPS and CES are being answered so closely, how do we separate them? How do we know what’s really the driver here? Right? Maybe it is being driven by NPS and not CES. Maybe it’s the opposite. We don’t know and we don’t have a way to figure it out.
Tami Salmi: So I think what we’re trying to tell you today is that we can’t. Ask one number to do all the jobs, and this isn’t about replacing NPS or that CES is bad, or, or again, even that NPS is bad. It’s just that we have to be very intentional about what we’re [00:13:00] asking these metrics to do. So the first step. To shift this is to make sure that we’re not designing surveys just based on convenience.
And when I say that, we see this all the time at Medallia, someone starts their initial survey and they use NPS, and now we’re gonna introduce a survey at a second touch point. And they say, well, I have to use NPS. That’s the metric. How am I gonna tie this all together? But the reality is we don’t wanna do that.
We wanna be really intentional about designing the survey for the moment. What metric matters for that moment? What actions are we trying to drive from the data? That’s where we get that ownership piece. It starts to become clear. We’re not just chasing our tails and collecting data for the sake of collecting data.
So if we put this into real life, right? Customer effort score. We talked about this earlier. I want you to think of this as like an operational early warning system, right? This is that question. How hard was [00:14:00] it? Really? The idea is this is gonna flag where did the customer hit a bump? Was that checkout process really difficult?
This is going to flag to the team that we have to fix something fast today. Now, NPS, right? This is our strategic metric. A little different here. What we’re gonna get from our NPS data is how strong is that relationship customers have with our brand? Did that new initiative that we launch actually make a difference?
So when we think about CES, that’s today’s fire. We’re trying to put the fire out. NPS though is about planning for next year so we can start to see when we put this all together, the reality is we have to really break this down and make sure we’re anchoring the metric to the moment. So that everything becomes clearer.
I’m gonna turn it over to you, Austin, to tell us about how you have put this into practice.
Austin Evangelista: Absolutely. So we’re talking about [00:15:00] all of these metrics, having different jobs, and if we’re talking about NPS today, what job could we give NPS? So we’re talking about a promoter score and how many of us here have, you know, maybe got a cup of coffee and at the end of that experience going, give me five stars if you could.
It helps me out a lot. I’d love it if we got a 10 star review or a 10 point review. You’re gonna have an emotional attachment to that feeling. Now when you go and respond to that survey, there’s a high likelihood you might give that person a 10. I liked that person who, who gave me my coffee. They always make it right for me.
But that’s not my entire experience. That’s just one point of the experience. It’s one person that I’m working with. We still use NPS at a post transactional place, but we’ve also included it in another place where we start looking towards relationship surveying. And we use that to help identify not just what the overall NPS is, but how that specific interaction is impacting your net promoter score.
So something like a relationship survey. There’s no immediate [00:16:00] trigger, there’s no person saying, please give me five stars. It’s just about the experience with your business, and you’re gonna get a lot more accurate of a statement from something like that than something that has that human interaction involved, and you’re gonna have an inherent bias towards it.
What we identified with that is, as we started to look at it, we had almost 15 to 20 points of difference between our relationship and our post transactional net promoter score. And that 15 points gave us a lot of room to grow and create action.
Jason Reilly: So we have separate metrics, we have them in separate surveys.
How do we leverage them? How do we join them all together? Right? We absolutely do want to have all these different snapshots captured. We wanna have all these different surveys captured and we want to join them together. We want to align them on some common point, customer location part of the journey.
How we do that is using TX profiles. What we want is, instead of having one massive survey. [00:17:00] One kitchen sink that collects it all. We wanna have a bunch of different individual snapshots where we can see the transaction, where we can see the effort, where we can see, you know, trust, whatever it is that you guys wanna look at.
We wanna be able to see it all broken out, but then aligned together on a point of common reference that we care about. Right? And that is what surveys are. They’re snapshots. Right. They tell us what the customers say. They don’t always tell us what’s happening, so we need to collect as many of those snapshots as we can, and we need to make sure that we understand their limitations, right?
We need to make sure that we know that not everyone is going to respond. We’re gonna have incomplete coverage. I’m sure you guys are all experiencing that. You’re all looking at survey response rates and looking at them dropping and trying to figure out why. That’s part of it. We have to understand that.
We have to understand that there’s also a delay. [00:18:00] Wait, I call it a snapshot in time. Surveys are a memory. Sometimes there are fragmented memory. Sometimes they’re a blurry memory. They’re still important though because they are the customer’s perception. The customer’s gonna action off of that perception, right?
So we need to understand it, but it’s important to know that it’s not the whole truth, right? It is a lagging insight. There is some time, maybe an hour, maybe a couple of days, but there is that leg. And then finally we have context gaps, right? We might understand why something occurred, maybe. We will get that.
Maybe we won’t. Maybe we’ll get what drove the outcome. Maybe we won’t, right? There’s going to be gaps that occur. There’s going to be missing data. It’s not guaranteed that the survey is gonna ask the perfect questions that capture every signal correctly. So we’re gonna move to the modern CX playbook, right?
We wanna change how we think and how we approach things. And the modern CX Playbook is built around four [00:19:00] principle key components. First. Experience data, right? Well, this still matters. Surveys, reviews, social, all of this stuff still matters. It’s how the customer feels. It’s their perception of your brand, of your service, of their interaction with you.
And yes, that is still a critical component of the modern CX playbook. Tammy said at the beginning, we’re not telling you, go home, rip everything down, rebuild from the ground up. We’re absolutely not. You’ve already got one pillar built. Right, but we need to layer in additional data. We need to layer in operations data.
What is your business doing? I did a study for a client there. One of the key problems was that their warehouses weren’t responding quickly to restock shelves. So they were getting lots of survey complaints. They were seeing a drop in their scores. The issue wasn’t that the people were upset or unhappy, it’s that they just couldn’t get the material that they wanted to get at the time they wanted.
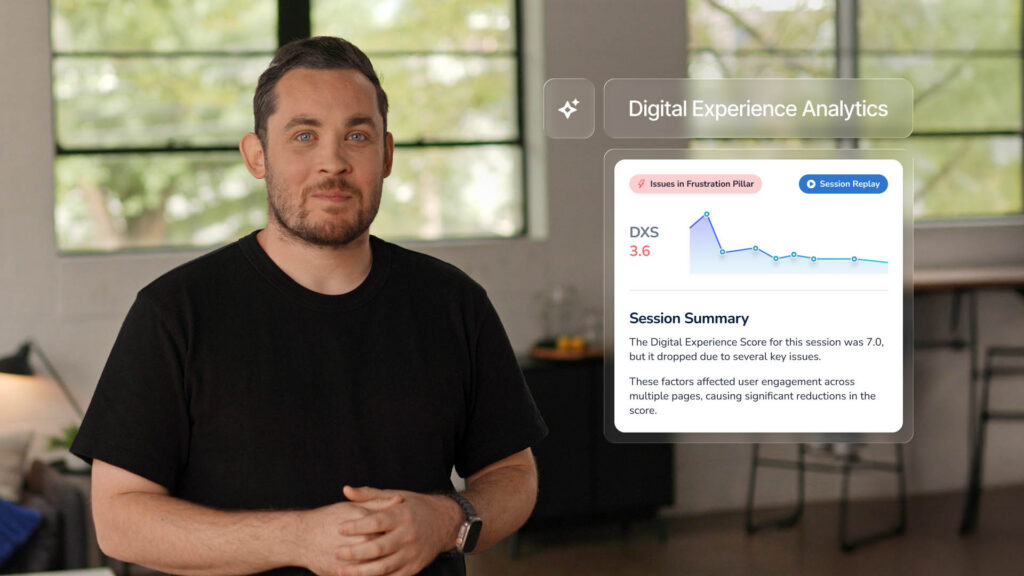
We need to see that picture to tell that story. [00:20:00] Luckily, they had that data. We were able to look at it and measure it and figure it out. They were able to layer in that operational data. They leveled up. We have to look at behavioral data, right? What is the customer actually doing? How long are they on your website?
How long do they engage with your app? What you know? How long do people spend in the store? What is, what’s your foot traffic look like? Right? Do they sign up for membership programs? Do they respond to your emails or, or accept coupon offers, et cetera, et cetera. We need to understand that kind of behavioral data.
And finally, we need to see the employee data. What’s your voice of your employee? What’s your training look like, right? What’s your churn look like? All of these things matter. All of these things are directly impacting the customer when they walk into your location, when they go to work with you.
Tami Salmi: Okay, so we’re gonna deep dive into each of these to help bring this to light a little bit more, starting with operational data.
Now operational data is really what experience looks like in motion, right? We have an example here, this first call resolution. The [00:21:00] concept of first call resolution is if this drops right? If we’re not resolving problems, obviously that effort score is gonna increase, so we start to see how things will show up in our survey data.
An example, like staffing levels, right? If we knew the staffing levels in the survey data, we’re gonna see that people have increased wait times. People are now rating our employee empathy worse. So the reality is, is that even though this is operational data, our customers are experiencing the outcomes of these metrics, which is why they are such a powerful addition to our CX data.
’cause we think about it, right? Our surveys can tell us there’s a problem, but operational data can help figure out the why. And what’s so nice about this is a lot of times in survey data we can see symptoms of issues. But just as Jason mentioned, when we layer the [00:22:00] operational data on top, that is when we really can identify root causes.
Sid mentioned this earlier, right? We don’t want CX to just be this reporting function. The concept is when we start to add in data like this into our CX programs, we can become more of a decision engine. Because now we’re not just looking at a score, we’re not just looking at a dashboard. What we’re doing is actually informing how the business runs, which is so, so incredibly important.
Austin, I’m gonna turn it over to you because you’re gonna tell us how powerful this can really be.
Austin Evangelista: Thank you so much. So we’re gonna go through an exercise. That’s one of my favorite examples of how we can use some of these metrics to really drive positive change and how we can incorporate different channels to get a new result.
So I think we’ve all had this circumstance happen to us where we’ve got store a, store B, two different stores in the region that we need to make a change at. We’re hearing that there’s negative feedback coming from [00:23:00] higher up, and we’ve all been in that conversation. What do I do? For these two stores to create more positive outcomes for our customers.
So now we start looking at CES. Along with that, this is our effort metric. That’s the first place I always love to look. Now we’ve got a 4.6 and a 4.6. So this is where we started to incorporate top box calculations. I started looking at what scores were the perfect scores, how many people gave me fives?
Those are the ones we’re really striving for. The fours are great. For keeping your CES average up, but fives are where I’ve got promoters. Fives are where people are telling their friends about us. When I look at this now, they’re starting to become a distinct difference. Now I’ve got a 70 and an 85, so one of these stores has a little bit of a higher effort than the other one does, and that deserves more investigation.
Whereas this other store is living in a healthier place. I should probably start bringing in some other angles. This is where we start looking at our voice of the customer. What are they [00:24:00] saying in our comments? And resoundingly for the CES with 70, we’re looking at mentions of wait time. That’s a huge point of friction for customers depending on the type of business that you’re working in.
So there’s some issues happening there with wait time, whereas I’m getting missing items for store B. So now this is a conversation. The same NPS, the same average CES, but two very different solutions, and we are only able to accomplish that by starting to bring in the VOC signal and start talking about our wait time, missing items, and listening to the voice of our customers.
I’m gonna hand it back over to Jason. Thank you. So operational data. This is what’s
Jason Reilly: telling us about your business, right? We just went over it. This helps us to understand your business. Behavioral data is what your customers are doing and how they’re interacting with you, right? Where they engage, where they’re happy.
We can track online abandonment. Shopping carts, adding things, time spent [00:25:00] on page. We can look at, as I said earlier, what are they doing in your app? How are they engaging with you? Are they channel switching? Are they trying to do something in the app? And then switching to the web and then switching to a call center, right?
We can track all of those different behaviors and see where points of friction are coming up. More importantly, we can also see where abandonment occurs. Where do they leave? Where do they drop out? Where do they give up? Right? We can start to track that before even a survey gets launched. Remember, customers don’t always complain.
Sometimes you don’t even capture their complaints, but they always behave. They’re always going to be doing something, and this is why behavioral data matters, right? As I said before, surveys are a snapshot. They’re a perception. They’re what the customer thinks about you in a moment, but behaviors show you what they’re doing.
They [00:26:00] show you how they’re acting. They show you how they’re engaging with you. Remember what I said at the beginning? We can objectively see things like spend and visits and transactions. We’ll improve before and after a promoter or detractor survey. They might get worse. They might get better, but we can see that we can objectively track it.
Right? When we are able to look at both in detail, when we’re able to look at customer perceptions, when we’re able to look at their behaviors, we can see those hidden frictions. We can see churn before it even occurs, right? We can start to see what are the flags that tell us churn is about to happen, and we can know when you might be getting a good score.
Yeah, I’m giving an NPS of 10 because I really like call center agent Sally. She’s wonderful, but I’m still planning on leaving.
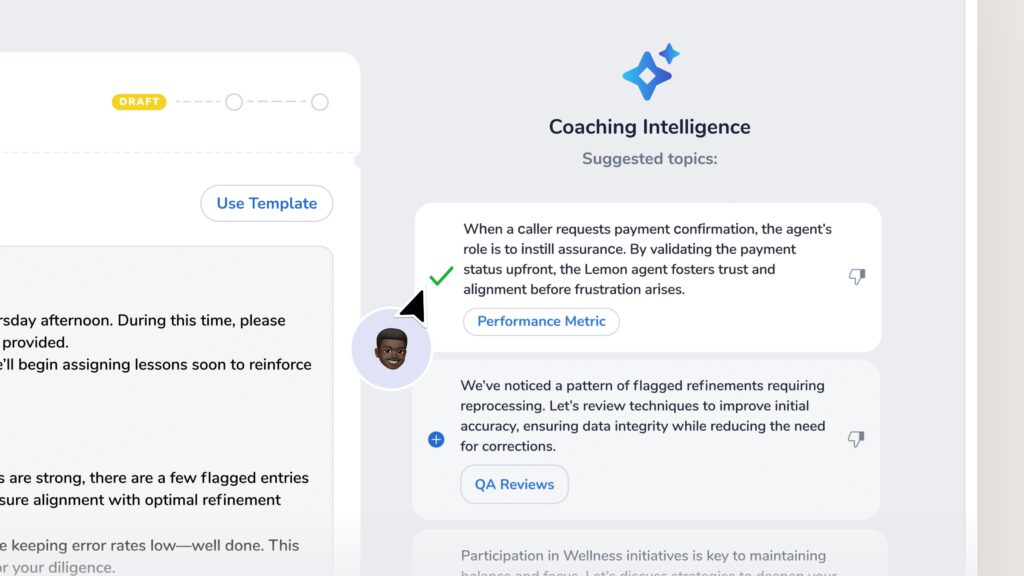
Tami Salmi: Okay, so we’re gonna be talking now about the last one. Employee data, right? This one is probably the most obvious and familiar with folks, but the reality is, right this frontline, VOC, that [00:27:00] at Medallia we call the voice of the customer through the employee.
We’re we’re hearing from employees themselves. What are they hearing about? More importantly, what are they fixing every single day for customers? We love to bring those suggestions into Medallia and use our TA on them, because that’s really gonna be powerful for us. Of course, we’re all familiar with engagement, right?
Do people show up with energy? Do they show up with pride? Maybe it’s fatigue enablement, pretty obvious, right? Do people have the tools and resources to do their job and do it well? And lastly, attrition and tenure. This again, like we all know the feeling of going into a restaurant and has just had high turnover, and it’s just a clunky experience versus working right with well-oiled teams.
The idea is that this isn’t HR data, right? This is impacting our customer experience. So when we bring this in and marry it with cx, what we’re able to do is tell the difference. [00:28:00] Between bad behavior and employee burnout, right? We can spot a coaching moment that actually just might be a bad system. HR data’s gonna tell us the difference between these two.
And what I love about this is it actually alerts us to friction on the front line pretty quick. ’cause most of the time this friction’s gonna show up. Internally first, right before we see it on our NPS scores. So this again is that early warning signal. And what I think is important here is that when we put this all together, we of course can improve our customer experience, but more importantly, we can protect it.
So I’m gonna turn it over to Austin now, who’s going to tell us about what this looks like when we listen to employees as well as customers.
Austin Evangelista: Thank you. So we recently decided to make a change at True Leave, where we wanted to help supplement our contact center by supporting that business through routing calls [00:29:00] over to our stores.
Some issues could be handled better by the person you’re gonna walk in and see yourself. So we went ahead and started routing some calls, and we made that decision based on some lack of first call resolution feedback. We were seeing that there was a decline in that first call resolution, and we also saw that some of these contact center calls had very high effort.
So as we started to run a pilot. At a very small scale, we started to identify the things that we need to watch. We started looking for that first call resolution. Again, that’s the main goal that we’re trying to improve, but we also want people to be satisfied, and we want them to be likely to return again after giving us a call.
So after running this pilot, we started taking a look at the data and started identifying, you know, what did we do right? What did we do wrong? Where can we find the opportunity? By doing that, we started to identify, we saw more calls from customers. Higher repeat calls, and a lot of people were expressing that there was an increased call volume.
So as we started to dig through all this data, we hit a point where we kind of ended, [00:30:00] there wasn’t any more channels that we could start bringing in to get that feedback. So we reached out to those employees that were a part of this program. By reaching out to these employees, what we learned is that there were some redundancies in this process.
Some of these calls were getting routed over that they really couldn’t help with, and they had to push it back to the contact center. And that was a routing issue that we could have corrected during that period of time. And there was also a communication, uh, issue where the reason why we were getting all of those extra calls, we just needed a second phone in the stores.
It was as simple as that. But all we needed to do was talk to an employee for just a moment, and we got that information very quickly. So taking a look at that, these employees gave shape to this process that we were trying to roll out. And as we started to expand this process, we saw smoother rollouts over time.
I’m gonna pass it back over.
Tami Salmi: Yeah, I love that story. So I what you all to understand, right, that N pfs is, again, it’s a great starting point. There’s nothing wrong with beginning here. The problem is, is when we treat [00:31:00] NPS as a destination and not just a signal, because we need to stop this focus on is our score going up?
Is our score going down? When we layer on all these different data points, right? This is when we really start to transform. We’re moving past just that reporting dashboard. Now we’re able to influence how the business actually runs. We can inform things like staffing strategies, we can inform product decisions.
We can do so much more if we think bigger and broader and not just focus on that score because if we overfocus on the score, our teams. All of our employees are going to unintentionally follow along. What I mean by that is they will only care about the score and not the behaviors that got us there. And that’s a problem, right?
Because we don’t. Have teams that wake up in the morning and won a game, a survey, but they will, if [00:32:00] that’s the finish line we give them, and just like Austin said, you’re gonna get that behavior, please give me a five star. And the reality is those, those people that do that, they’re actually not failing at customer experience.
They are succeeding at the goal we gave them. We gave them the goal to meet a number. So that’s what they’re doing. So I want you to think about as we move from this, Hey, how do I get my NPS score up? Rather than they’re just focusing on the score itself. Let’s start to look at behaviors. What could we do?
What could we do more that makes our customers wanna give us a 10 without even asking. And that shift is pretty critical because NPS, at the end of the day, I promise you, you are, this is not the goal you are trying to achieve. It isn’t just a score that’s gonna get us to the finish line. It’s just a signal.
And I think of it like, like that warning light on your car’s dashboard, right? It’s telling us there’s a problem. We’re gonna [00:33:00] have to go look. But everybody knows you can’t fix your car just by staring at the dashboard. You have to do the work. The funny thing is the work doesn’t happen in Medallia. The work doesn’t happen in a spreadsheet.
We have to go to that store, we have to go to that call center. We have to collaborate and fix that confusing process, right? It’s about changing behaviors. Now, the reality is, is that we have to remember that the scores follow the work. Not the other way around. I will say that again, if we think about the number and focus on the number, everybody in your organization is going to just focus and optimize for the number.
But if we focus on behaviors, I assure you those scores will follow. They will follow. If you think about it this way, if you are in trying to improve your health, you wake up every day and you weigh yourself [00:34:00] on a scale, that’s not enough. You have to do the work. We have to have a behavior change, right, in order to see the outcomes.
And so I want you to think about how we can encourage those behaviors that we’re ultimately going to increase and improve our customer experiences. Now, I think most programs fail a little bit because they try to improve everything and ultimately end up improving nothing. I assure you, you do not need 46 initiatives to improve your customer experience, I promise you.
We have to really hone in on the moments that matter. Where did somebody get confused? Maybe something was brilliantly simple to understand and that was surprising to them. Maybe something was really frustrating. We have to use our customer journey maps. Do some journey mapping or break up the map you did five years ago, that’s fine, [00:35:00] but find those moments that matter and then ask yourself again, not how are we gonna raise the MPS score, but what behaviors can we do in this moment to make things better?
The other thing that we, we think about, we have those moments. We’re gonna identify them, we’re gonna identify the behaviors, but now we have to measure the behavior. So we’ve been talking about these key metrics and PS CES, but the reality is don’t forget that we can also also ask survey questions that gauge the behaviors.
’cause this is where we want teams to start taking action. Did somebody greet you within two minutes of you walking into the store? Did you find everything you were looking for? Was the checkout process smooth? Did somebody in. Wow you or surprise you in the store. These are asking about behaviors that we want to drive because that is how we’re gonna get our NPS score to go [00:36:00] up.
At the end of the day, we don’t have customers that go to an experience and say, wow, that was worth 10 points. Right? I should say 11. It’s an 11 point scale. The reality is right. We really wanna think about not just designing metrics for just everything, for consistency. We wanna really focus on the moments we have to anchor back to the moments and remember.
Employees, customers, we are getting that survey data and it’s giving us the score, but we are really designing about how people feel at the end of the day. So just please take away the fact that behaviors are so incredibly important to produce change.
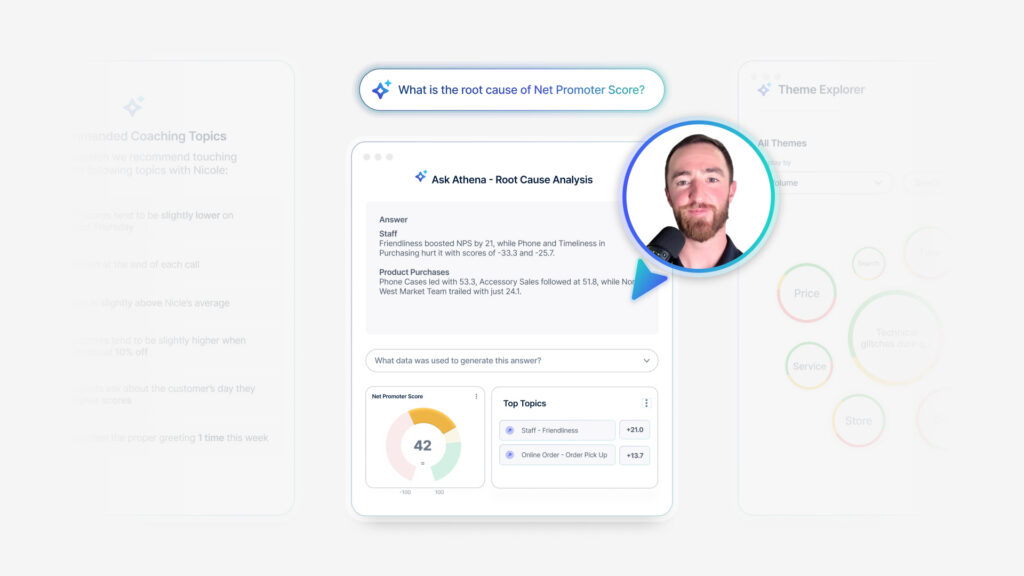
Austin Evangelista: And so how do we measure that? So how many of you are using text analytics and see that agents or associates are like the top positive comment that you see coming up all the time?
Okay, that’s a healthy amount of hands. I saw the same [00:37:00] exact thing, but what I noticed is a lot of the response just ended up being like, yeah, the person in the front was really nice, or I really liked the guy he helped me like three weeks ago. I don’t know who that guy is. You didn’t tell me who that guy is.
How am I supposed to find out? So I had an agent on my team come to me and say, what if we gave them the opportunity to talk about it? And that’s where we started, including this delight in our surveys, not just asking, what can we do better? Or Is there anything else you’d like to share with us today?
We’re asking a question, who really went above and beyond for you today, or who really helped make your experience exceptional? We then can collect that feedback all in one compact space and review it on a weekly basis, and we don’t just let it sit there. Of course, it’s really nice to read all the positive things your customers have to say about it, but it’s even more helpful when you start delivering it to those teams that are creating that impact.
They’re creating that positive experience, and they’re happy to provide it for those customers. This is your opportunity to recognize those [00:38:00] frontline employees that are making those customers happy. So we went ahead and started including it in our weekly newsletter. And now everybody gets to see who’s providing those exceptional experiences and what it is that they’re doing that’s making that experience exceptional.
Giving that chance to spotlight it is how you’re gonna help improve that delight, and it’s also going to give you the opportunity to celebrate your teams. So we’ve had a lot to talk about today and a lot of information to go over. So what’s your plan for next week? I see a lot of laptops out. Take your finger off the delete button.
We’re keeping NPS still. We don’t have to tear it apart. But there are a lot of things that you can use to supplement it. I would encourage you to add one signal. I’ve talked a lot about NPS or CES today, and that’s a number that I really like, but maybe for your business value is better. Or maybe it’s something about associates that is better for you.
Add that one signal. With your teams or begin mapping your data to something additional, something [00:39:00] outside of what you’re currently looking at. What I recently discovered is we were looking at those effort scores. That example about wait time. It wasn’t just about looking at that wait time. My first question was, well, do they even have enough people in store to help the amount of customers coming in?
Is that something I can help with? I reached out to my data team and said, what information can you give me? About this. Turns out this was a pain point on their side as well. They said they’ve got plenty of hours at that store. We want them to use it. Help us support them in using it. We were seeing that allocation that wasn’t getting used and it would made it so much easier to have that conversation with those teams, and now they’re at full allocation and our customers are incredibly happy.
So even that opportunity, it was a win for me just as much as it was a win for our data team. And I know I’ve heard a lot this week that a lot of people feel very siloed in the CX space. Sometimes it’s as simple as reminding everybody that a win for CX is a win for everybody. You can also start that huddle.
Have a [00:40:00] conversation with those groups. Get everybody together so you can work together. Cross-functionally. We are that connecting group of individuals that can really start to bring change, not just in your sector, but in all other areas of your business. And then reframe that goal. We’re measuring delight.
We’re not measuring a number. Just go up and down. And so this is the mindset that Jason’s gonna tell you about.
Jason Reilly: So, yes, the new CX mindset. So this is what we wanted to nail home today for all of you guys, right? This is what you’re doing. At the end of the day. You’re going back and you don’t need an overhaul.
You don’t need to catch all kitchen sink survey, and you don’t need a broader lens. You just need to listen, and you need to judge. Alright, I’m just gonna pause here for questions. Uh, please remember, we also have, um, a survey, uh, QR code. If, uh, you wanna take a moment to provide some feedback for us, we would greatly appreciate it.
Um, and we’ll now open the floor.
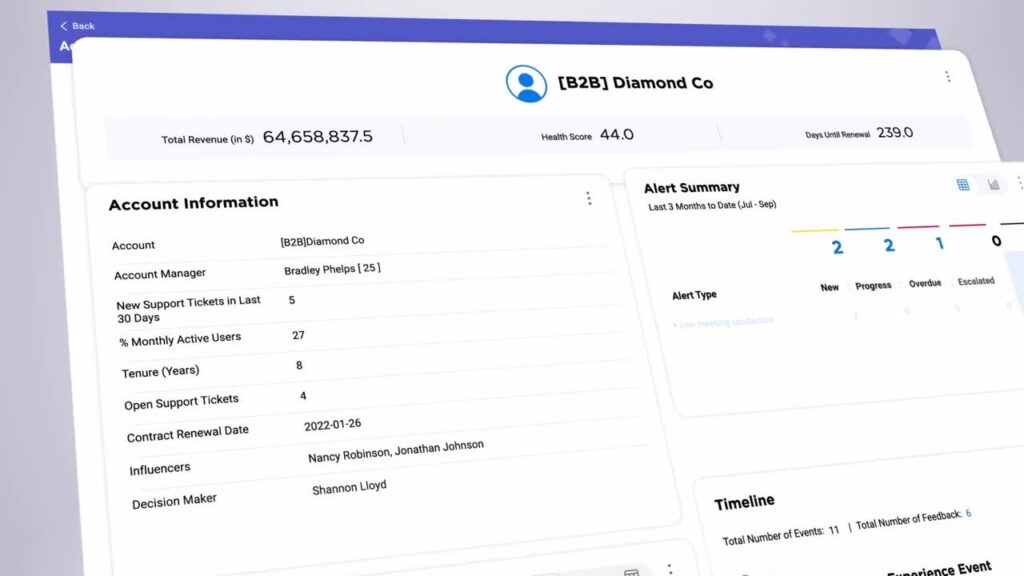
Audience Question 2: EJ Halpert from B and H. Um, a lot of this was, [00:41:00] you can’t really tell why NPS shifted, so we have to start looking into behavioral data, but I guess I’m a little. Cut back because I, I am really focused on NPS and we measure shifts in KPIs and how much that reflects their NPS shifts.
And then we also measure their TA and text analytics in impact scores. And that sentiment, what are the core problems and why did the score drop? And when we look into that, we are worried. I, I think I. I’m able to drill down into NPS swings. Mm-hmm. Now, I, I do agree that we have to start bringing in more channels, but, um, I guess what is the added benefit of looking into people wait time, behavioral data, when you know that people wait time is the core issue.
Jason Reilly: Do you wanna take it? You can go ahead. Sure. Um, so great question. When you’re looking at these issues, um, if you know it’s the issue, if you know it’s the problem, [00:42:00] now you have the ability to look at it from a census perspective, right? Typically, when we’re looking at surveys, we’re seeing them as, as just a sample, uh, response rate, et cetera, et cetera, the issues that I already highlighted.
But when you are able to look at the behavioral data in total, when you’re able to see every single interaction, you can actually see it from a census perspective, which gives you more. Or accuracy, which allows you to more narrowly focus what is impacting things, where the problems are coming in, and immediately see our fixes providing immediate solutions.
Are we seeing changes occurring based on the actions that we’re taking, which allows us to tie it to ROI, right? If we’re investing. $200,000 and doing some kind of website overhaul to show improvement. Are we seeing immediate changes in the behaviors that we targeted that are valued at $200,001 or more?
Audience Question 1: With pulling in other sources of data and also having your survey data? Are you doing anything to either like weight responses or [00:43:00] anything too? I guess help ensure that the survey responses you are gain, gaining are an accurate representation of your like full customer base. Go ahead.
Austin Evangelista: Yeah, I think it, so what we typically like to do is I’ll go back and connect it directly to that transaction.
So it’s not just a, I’m looking at NPS, I’m looking at CES, and I’m looking at this behavioral data all on like separate channels is I’ll take an individual group or a subset and say, this subset is people who gave me a one on my effort score. And that subset of people when matched up to these transactions, I can see the rest of their journey because I brought.
At that data indirectly, and then I can start looking at those other factors and identify it. Is it maybe a location issue? Like is it just where they live or is it socioeconomic looking at all of those factors, I’m only able to do that if I connect it customer to customer instead of just general groups.
Tami Salmi: We are officially out of time, [00:44:00] so I appreciate everyone joining us for their first breakout. We’ll be up here if there’s any lingering questions, but thank you all.
Jason Reilly: Thank you everybody.