Roshni Goel: [00:00:00] Welcome everyone to the Hands-On Workshop on Translating Experience to Dollars. My name is Roshni Goel. I’ve been in Medallia nearly eight years, seven of those years on a Medallia strategy analytics team, working alongside clients like Selves, looking to prove value, and ROI from your CX programs. So it’s really my pleasure to be here today talking to you about a topic that’s near and dear to my heart.
Noam Zerubavel: Hi El. My name is Noam Zerubavel. This is my fourth year at Medallia, and my specialty is helping clients such as yourselves demonstrate the value of your CX program by demonstrating how CX impacts important business outcomes.
Roshni Goel: So a little bit about what we’re gonna talk about today. First, we’re gonna cover about why financial linkage matters and what it can do for you.
Then we’re gonna walk through some real world examples of how peers [00:01:00] in your shoes have demonstrated the financial justification they needed to drive action and investment in their businesses. Then we’re gonna get into the workshop where you are gonna start playing around with designing your own hypotheses.
You’re gonna work in pairs on this to test and refine, and then if we have time and we have some brave souls in the audience, we’d love for one or two of you to present to the wider group. This is a safe space. Then we’re gonna get into some next steps that really are tangible that you can start taking the moment you get back to your desks or offices, and we’ll wrap up with some q and a.
I want you to imagine. Two different program owners who are presenting to their respective executive leadership teams. The first presenter walks in with a crisp story about their CX program. They explain that NPS is down [00:02:00] five points this past quarter, and that it’s primarily driven by dissatisfaction with long delivery times.
There are nods. Around the room, but when the discussion moves to resources needed to fix the issue, the conversation stalls and the presenter walks away with agreement on the issue. But no clear next steps or direction or recognition from the leadership team on what to do next. The second presenter walks in with a different story.
They show. The long support wait times are driving frustration amongst the business’ high value customer segment, and that reducing this wait time, even by a small amount, could result in revenue mitigation to the tune of $20 million. [00:03:00] The exec team leans in closer. They ask more questions. And now there’s a lively conversation about what needs to change and where to invest, and that’s what today is all about.
How to turn the CX insight into executive action and investment, because between those two presenters, the difference wasn’t the inside. They both had really great CX data. The difference was a translation on how they went from the language. Of net promoter score, effort, satisfaction, feeling sentiment to the language of business, revenue, growth, retention, lifetime value, your teams speak, experience.
However your leadership speaks dollars and cents, because here’s the reality, [00:04:00] executive leaders are not only more likely. To invest, but they will stand up and champion your programs when you can show how your program directly impacts revenue growth, cost reduction, or risk mitigation. That’s the language of executive sponsorship in fact.
Poorly engaged executive sponsors is one of the key reasons where we see programs struggle or fail. So now let’s take a look at a few examples of how peers in your shoes have made that leap from experience to dollars.
Noam Zerubavel: Now we’re going to show you a simple financial linkage framework and a few examples to help illustrate the application of that framework across different business contexts.
These three examples are going to speak to the three business outcomes that ROI discussed. The first example is going to focus on [00:05:00] revenue growth, the second on cost reductions, and the third on risk mitigation. And as we walk through these slides, I just want you to remember that. You don’t have to be a data scientist.
You don’t have to get caught up in the weeds of data science. This isn’t really about data science, like RO mentioned. This is all about making a logical hypothesis that translates customer experience into business outcomes. And that framework is as simple as 1, 2, 3. So one, we have the business, KPI. Two, the CX metrics, what are we actually doing and measuring?
And three, how do we connect those two to link them together? This first example is all about revenue growth, and it comes from a retail client. In retail, often the easiest way to measure revenue growth is in terms of transaction size. Now that’s just the case for retail. So in all of your specific industries, there will be different specific kinds of metrics that might [00:06:00] speak better to revenue.
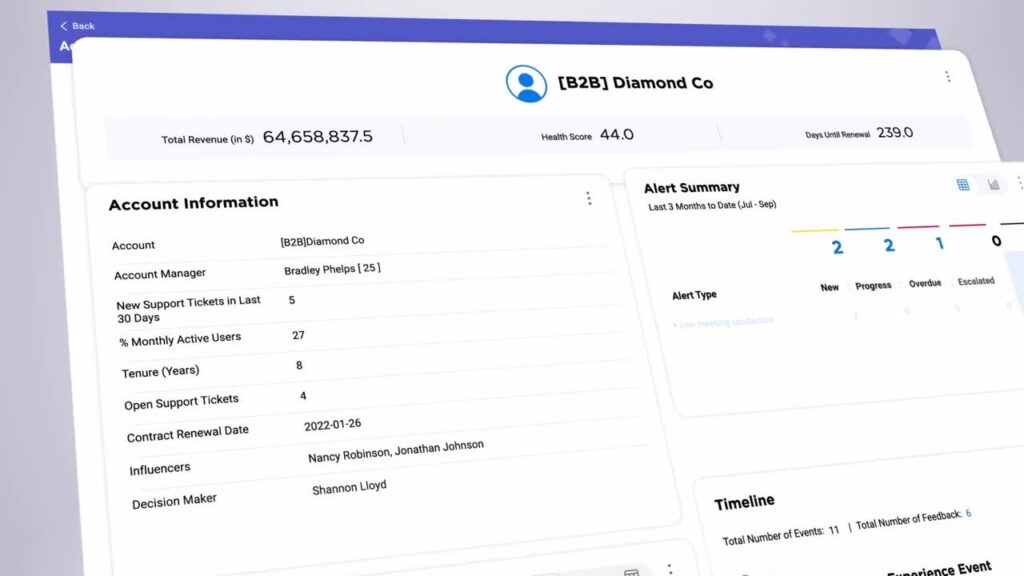
So for example. Um, if you are in hospitality, revenue growth might be better captured by a metric such as average visit spend, for example. Okay, so returning to our retail client example, store locations differed on this outcome, how much revenue they generated per transaction. A pro tip here is that in your Medallia instance, you might actually already have aggregated revenue data such as average cart size by store.
So now that we’ve defined our business, KPI here, what about the CX metrics? Right? What about on the CX side? On the CX side, our clients wanted to focus on ease of finding products. And the reason for that is because they had a, a pretty simple hypothesis. Connecting ease of finding products to revenue.
They thought maybe there are some store locations where it’s very hard to find products, and because of that it’s going to lead to smaller cart sizes. So a pretty logical kind of hypothesis. Not driven by the data, but just by something [00:07:00] pretty reasonable. Alright, so let’s see what they found. What we were hoping we found is that.
In the store locations that made it easier to find the products. There were 25% higher cart sizes too. And remember the two scenarios that Roche presented earlier. Remember, it’s not just about NPS, but what do you actually do with it, right? In this case, here’s what the customer did with it. They identified poorly organized stores to prioritize for modeling, and then they also identified and generated new training materials for store managers based on best practices from some of these top performing stores.
In the next example, we’re going to switch our focus to a very different category of business outcome related to cost reduction, and specifically we’re going to look at an example of. What do you do if you are a digital owner and you believe that your digital program is impacting omnichannel savings?
Right? Specifically on the call center side, if you are the digital owner, you might be thinking, gosh, where am I [00:08:00] going to get that information? Well, guess what? Even if you’re only responsible for digital, one of the great things about Medallia is that you can find contact center information in your Medallia instance, and this is another pro tip.
Which is that you can actually have a proxy for who calls into the call center just using the post-call survey invitation file. And throughout this presentation, I’ll be giving you a few pro tips of how you can try to find and identify some financial and operational metrics that may be more easily available to you than, uh, than you might think.
So in this case, uh, our clients went in with a very general blanket kind of hypothesis that their digital frustrations were leading to more call center calls. And when they went in to do this analysis, they did not find this pattern overall. And for better or worse, this is actually normal in financial linkage.
It’s an iterative process, right? And what that means is that it requires refining your hypotheses. And that’s a lot of what we’ll be doing today too. [00:09:00] In this case, our clients refined their hypothesis to focus on one specific customer segment, baby boomers. And what they found is that baby boomers were disproportionately driving up the call center costs because of digital frustrations with online bill payment that were leading those baby boomers straight to the call center instead of digital self-serve.
And what did our clients do with these findings? By prioritizing the specific app and website. Features that were pain points for baby boomers, they were able to reduce call from baby boomers by 10% leading to an annual cost savings of over $60 million. And in addition, they also leveraged these insight, these omni-channel insights for new marketing materials.
So again, not just about improving MPS, but also what do you do with this at an organizational level? The third example is all about closed loop feedback. In other words, how do you demonstrate the impact of closing the loop? I expect that many of you probably close the loop with your [00:10:00] customers, right? Um, raise your hand if you close the loop with your customers.
All right, great. That’s good to see so many of you closing the loop. Now, keep your hand raised if you can actually demonstrate that closing the loop is actually having a business impact. I see fewer hands. Uh, okay. And one last question. Raise your hand if you would like to be able to show that your CX program actually reduces customer return.
All right, great. And that’s exactly what our clients’ wanting to do too. They wanted to find out could they show that closing the loop with customers really matters. And here when we say matters, we mean matters in terms of actually impacting customer churn. And then in addition, they also wanted to know, does it matter how quickly we close the loop?
We helped our clients answer both of these asks. So first we found that closing the loop drastically. Reduces the risk of customer return. More than that, we found that the critical response time [00:11:00] was 48 hours. Now, I don’t want you to get too hung up on the 48 hours. That specific number is going to vary across industry business context.
The point that I want you to focus on here is that financial linkage allows you to answer that question directly for your business using your own data. And in this case, our client’s data showed that closing the loop within 48 hours hald the risk of customer churn. Another way of saying that is that it doubled the odds of customer return visits.
Now, you might be wondering, how do I know if customers returned? And again, here we have a pro tip customer return, or the flip side, return visits can be tracked using the invitation file for a post-transaction survey, and then you can tie that to a dollar amount using some standard. Business assumptions about average transaction value, whatever makes sense for your business.
In this case, what our clients found is that quickly closing the loop generated their business over $4 million. More than that, it helped achieve this kind of organization-wide alignment [00:12:00] around closing the loop within 48 hours. So you’ve seen a few examples of how this framework is applied, right? And now you’re going to do the fun part, designing your own financial linkage.
Roshni Goel: So in front of you, you’ll see the worksheets that we have. If you take a look at it, it has five questions in total. There’s space for you to write down your answers, and also below each question, there’s an example answer to help you get started. We’ll also have some reference material. You’ll see that at the center of your table.
So when you get to the questions around business metrics, customer experience, metrics, you can take a look at these. We’ll put them up on the screen as well. What you’re gonna do in the first five minutes is you are gonna complete the worksheet up to question four eight. So again, first five minutes up to question four A and then you are gonna turn to someone next to you.
Introduce yourself and partner up. So for the folks who maybe you know [00:13:00] by themselves at the table, I’d encourage you to maybe turn around and find someone. What we’d like you to do here is now present your hypotheses to your partner, and if you are the partner, you have an important task here. Your task is to really.
Listen, stress test and challenge that hypothesis. Try and understand like, why does a presenter believe that this particular aspect of their program will have the biggest impact on their chosen business metric? And also ask them to get a little specific. Ask them, are there specific customer segments or parts of your business where you think this hypothesis will hold true?
So you’re gonna work on that together. Remember, as Noam shared, this process can be iterative in a refinement process. So don’t be afraid to start over as needed and try to get as specific as you can. Then you’ll write your [00:14:00] answers down in question four B. So you’ll spend five minutes presenting and then again, we’re gonna switch, and then your partner will present to you and you will help stress test it.
And we’ll do the last question, question five, together after no one provides us with a little bit more instruction. We’re gonna be walking around answering any questions if you get stuck. We’re also very thrilled to be joined by four Medallions here. So we have Christina, Cassie, Juan, Jason at the back, and we’re all here to help you as you go to these worksheets.
So, yeah, let’s get to it.
Noam Zerubavel: I am so sorry to cut off this very, very productive discussion that I know we’re all having right now. And for those of you who are very, very engaged, I would like to see if there’s a brave volunteer. We are good on time right now, which is just as we were hoping. Would anybody like to share?
[00:15:00] Discussion. Again, there are no right or wrong answers here. That’s part of what we’re trying to show.
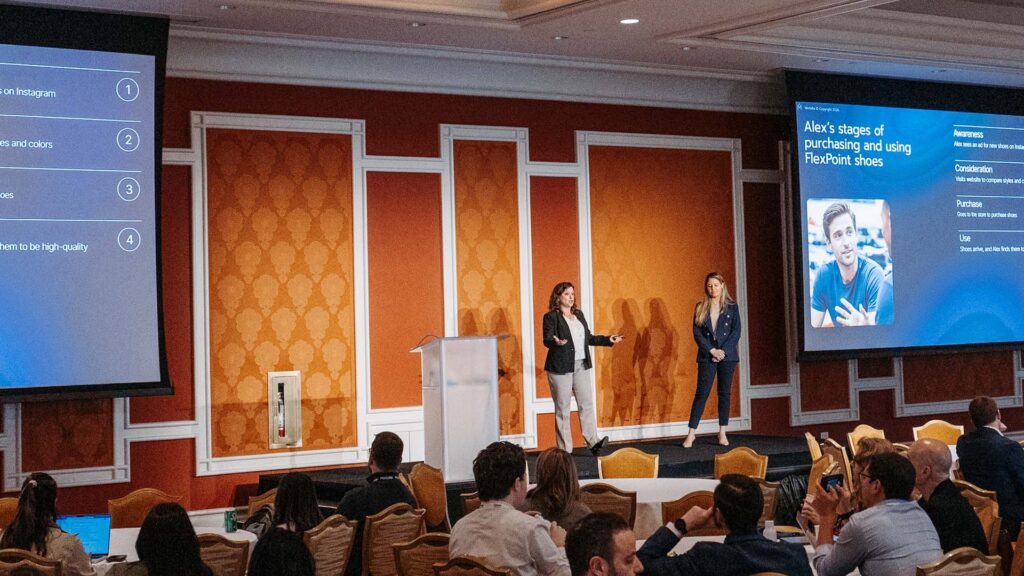
Audience Question 1: Hi, I’m Alex. I’m in Digital CX at Macy’s. So, um, one question that we get a lot is about non purchasers who we obviously survey through intercepts on our site. So for me, I put ease of navigation a as a big, like customer behavior one, and we work really closely with product managers.
So when we are trying to get. Different features and enhancements and fixes prioritized on their roadmaps. I think showing the link between ease of navigation, CS a, and conversion would be. A huge one.
Noam Zerubavel: That’s great. Wow. Thank you so much. And that was also a fantastic segue into next steps and what do we do with this, right?
This is supposed to be a really action oriented kind of workshop where this is just the first step we’re going to go through kind of step-by-step here what the next steps are. It’s going to vary for lots of different kinds of financial linkage projects where these things end up going. What we did today is [00:16:00] the really the most important first step of formulating the hypothesis.
There’s a more mechanical aspect of doing the linkage, um, which you can do in-house. You could also come to us to help with that. So what we’re going to focus on here are just a few of the different ways that you can go about these next steps. And there are three questions that you’ll see on your worksheet where it says number five.
So if you flip over to number five, and as we go through this section together, just as I’m talking. Please feel free to, uh, write down on your worksheet what are your next steps as we answer each of these questions. So first, who can I partner with internally on this project? Find your friendlies. Right?
So often we found in our experience that CX teams can partner really well with their counterparts on it, for example, and more specifically for question number two, which people and teams. It can help me access data relevant for my business Outcome of interest. So on your worksheet, if you’re the owner of a digital program and your financial linkage hypothesis, is that [00:17:00] closing the loop faster?
On the digital side, uh, with digital detractors is going to impact the contact center. Who on the contact center side are your stakeholders that you would want to talk to about getting that data? And I would also encourage you to start taking a look in your Medallia instance, uh, to see what relevant CX data and even financial and operational data you already have in the system, either at an individual customer level or an aggregate level like we were looking at with the first store example.
For number three, we talked about a few different kinds of shortcuts that you can try to use as proxy measure for key business outcomes. I listed a few here, such as how you can try to index customer churn or the flip side of that return visits using the invitation file for a post-transaction survey.
But I, I just wanted to mention, I heard from a couple of people here who were in B2B and financial services. Another kind of, uh, tip that we did not cover is that. In those sectors, we tend to find that customer churn can be more easily indexed, often using relationship surveys. [00:18:00] So if you are absent on a future relationship survey, that means that you churned, right?
So these are just kind of proxies that you can use for some really important business outcomes. Just leveraging your existing survey data. Including the invitation files.
Alright, so again, as we wrap up, I just wanna remind you that this is that first step in formulating the hypothesis.
We, uh, can help you with the mechanical process of linking those, uh, those data sources together.
We can help enable you to do that as well. I would make a pitch to, uh, to see the CIBC talk later today where we did just that with those clients. If you have any more questions as you’re going through that process in the future or even today while we’re here in person in that experience, please come talk to us.
And I know that, uh, what. Happens in Vegas, stays in Vegas. But, uh, I will make a pitch that if you want to share your, first of all, please do take your worksheets with you. They should not stay here in Vegas, but also use them to come talk to us as the beginning of a conversation starter. These are exactly the questions that we always talk to our clients about when we’re having these [00:19:00] initial conversations about financial linkage as we go into the q and a.
Please scan this QR code and share your feedback. So we practice what we preach here at Medallia and so your feedback is always valued. Thank you again, and we’d love to answer any questions that you have.
Audience Question 2: Hi. I am, uh, Austin from True Leave and I have a question about one of the examples you were talking about earlier with.
The CLF form. I think that’s a wonderful way to show ROI for that program. My question is, what recommendations do you have to help filter out some of the noise in those processes? So for the sake of this example, let’s say I’m talking about a closed loop form within a certain period of time would increase that next purchase value and they would in turn spend more as a customer at a retail space.
Who’s to say that when I return that number, somebody doesn’t turn around and go say, well, there was a sale that day. We pushed marketing to a specific group of people and that’s why, how do you help kind of filter out that noise so that your message of the CLF gets across?
Noam Zerubavel: I love that question. I think, [00:20:00] um, CLF specifically, I think there are so many opportunities for trying to directly show that it’s.
Your action as the CX program, you are closing the loop that actually caused that impact because you can kind of do more of an, uh, an actual experiment. You can ab test between different channels. And this speaks to what you were saying about the noise or kind of like how do you isolate the signal. So I.
In addition to the examples that you gave, I think another kind of source of noise is that sometimes we close the loop by email. Sometimes we close the loop by phone, right? And those two sources, you might find that one of them is effective, one of them is not effective. Or it might be that there’s a certain customer segment, uh, loyalty members at true Viv that are, if you close the loop with them, it has an impact that maybe not with other members.
There’s no one size fits all. That will be the, the right answer for you. But those are the kinds of questions that we ask as we go through the data in order to try to find the strongest signal that we can.
Roshni Goel: I’d also encourage you to think about just a law of large numbers. So yes, maybe on that time there’s a marketing promotion or there [00:21:00] was a campaign running, but if you are tracking this.
On and over again. There are gonna be times when you know, customers come back and there isn’t a marketing promotion to fall back on. And so the idea is to not just do this as a one-time exercise, but to continue tracking this over time, even after closing the loop, right? Like what happens if you’re in retail?
You have faster purchase cycles. So what happens after 30 days? What happens after 60, 96 months? Right? Like and then. There’s always seasonality in retail. So you, once you do it over the period of a year, you can start to control for some of those variables.
Cassie Wilcox: If I could add one thing too, um, I think, you know, in the business of CX where we’re also in the business of banging our head against the wall, a lot of times, you know, we may come to the table with really amazing insights and we have to be storytellers.
We have to bring our executives along with us. Really, it comes down to the change management of it all, and how are we gonna [00:22:00] communicate this effectively? So I always love going into these conversations knowing I have a really solid financial linkage. But knowing that these people in the room, they’re gonna come up with their own resistance, they’re gonna say, well, what did you think about the promotions?
And I think it’s really important to address a lot of that head on to say. You probably thought that that could be impactful here. So I just wanna let you know we’ve taken that into consideration and these are the steps we’ve taken to kind of get around that, that little barrier. So it really like the communication and the storytelling is like such a huge component of all this too.
Audience Question 3: Hi all. My name is Luis Costa, part of the CX team in the best per, uh, bank company in Peru. Uh, we are working on the CX economics, uh, right now. So in order to create the best gand as possible, if it’s better to link the financial data with MPS, it’s better at the first stage just to know where we are and [00:23:00] where do we have to put all our, our eyes and then try to link with the operational indicators or what do you think about that?
Noam Zerubavel: I don’t think there’s a, again, a one size fits all answer. Um, I, I think the reason for that is that NPS, it could be something that, let’s say you see that at certain branches, uh, let’s say at a, that there are branches that have worse cx, worse NPS and also have worse whatever your financial outcome that you’re trying to look at.
And so there could be that pattern there that you’re seeing overall. And my personal experience is just anecdotal, but. I think we found with, uh, with banks a lot of really, really strong evidence that CX impacts churn and retention. And so, uh, I would focus at the individual level and this is just kind of a guess without having looked at your data at all, but that would be where I would start.
But happy to talk to you more about that and uh, also to other banking clients we can get together. I know there were a bunch of banking questions that I heard as we were going around. Anything to add to that Roe?
Roshni Goel: I would just say like, again, a lot [00:24:00] of the focus when we talked through these questions was thinking about what matters to your leadership.
So go back to that, right? Like which financial metric, which operational metric, and start with that being your priority list.
Noam Zerubavel: I Okay. Saw in your example that there was like a, you pick one of your KPIs, see if that had any effect on. Total. Is that the recommended approach or would it also maybe make sense to just put all of your KPIs into a model and see which ones have the most effect and then drill down kind of.
Roshni Goel: You can play around if you have more data to play around with and try different ones and put in a model, I would highly encourage that. But yeah, let’s keep talking. We are at time, so thank you so much everyone for attending and please, please, please provide us with feedback ’cause we’d love to make this more relevant for you.
Thank you.