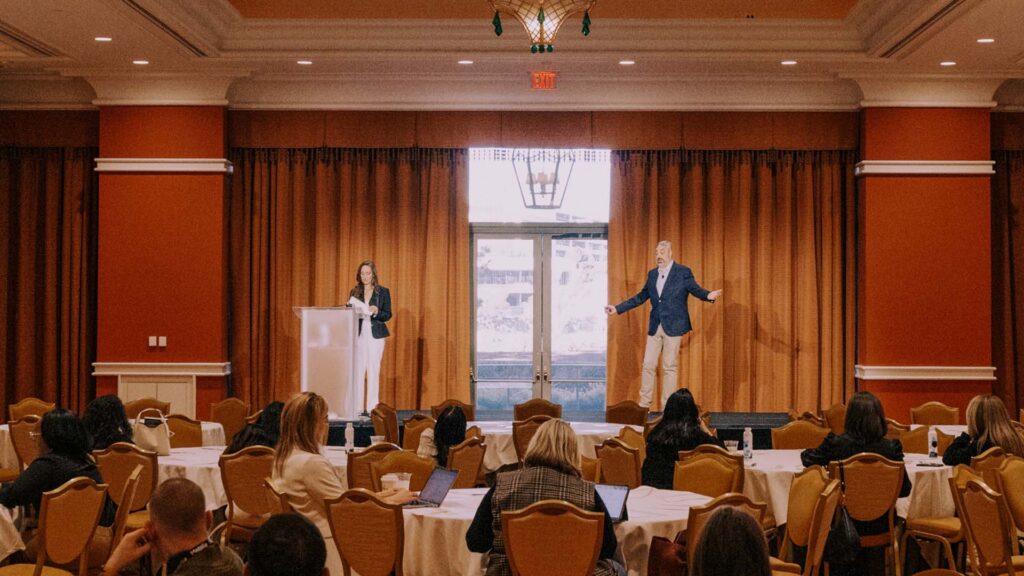
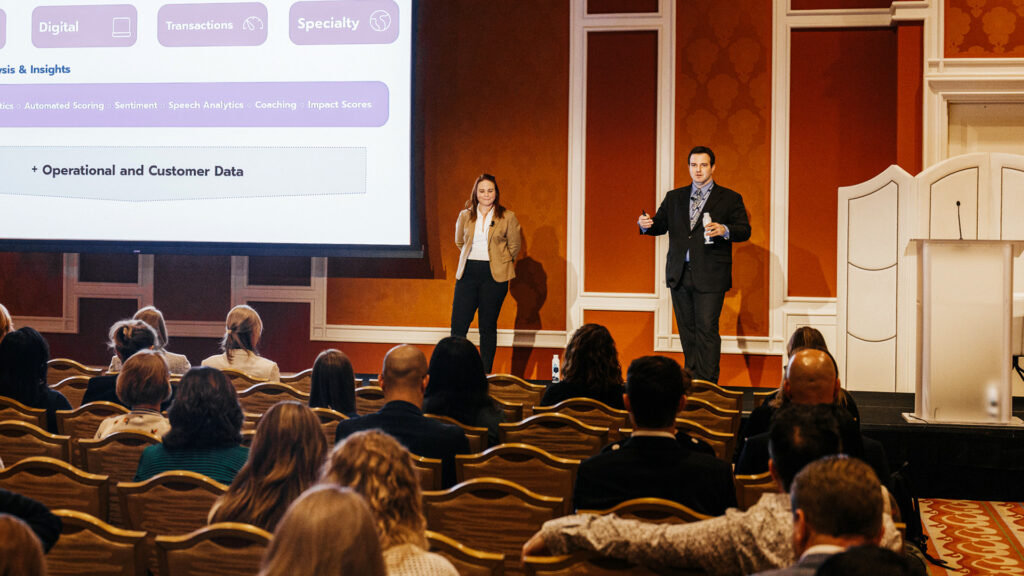
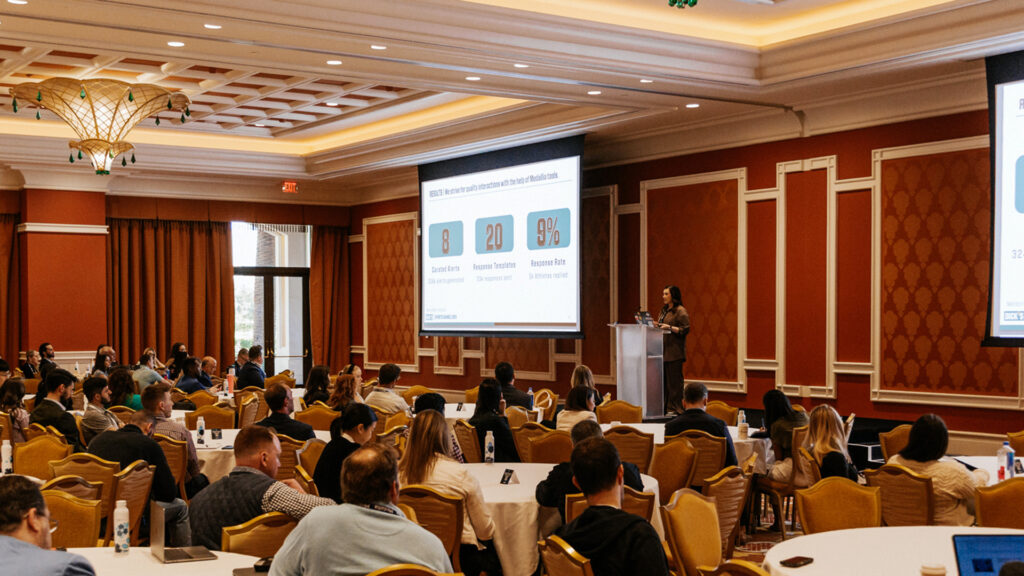
Kristi Nickl: [00:00:00] Welcome to “unlocking the power of frontline teams: small insights, big results.” I’m Kristi Nickl. I’m a principal customer experience advisor here at Medallia. I have been supporting the retail, restaurant and hospitality industries. For over 20 years I’ve been developing these kinds of programs, CX programs, implementing them, driving adoption, as well as supporting governance strategies.
Sandra Storey: And I’m Sandra Storey, also a principal CX advisor at Medallia. I’ve been here about four years. Prior to that, I worked in financial services, so that’s the vertical I support now, both B2B and B2C. And in my previous world I did everything from leading teams to coaching the coaches of teams to implementing CX programs and driving organizational change with that, the customer feedback and signals that we get.
Super excited to be sharing with you. Lots of fun stories today. So Christie’s gonna take us through the agenda.
Kristi Nickl: Absolutely. So we’re gonna dive into [00:01:00] what it truly takes to empower your frontline teams and ensure that they’re set up for success. We’re gonna start with frontline empowerment because it is critical to understand why it’s important, how it drives better cx, and ultimately your insights.
And then we’re gonna jump to some practical frontline strategy. So how do we equip your teams with the right tools and techniques to really thrive? And then we’ll also dive into some data-driven guidance, which is really about empowering your frontline to ensure that they can make informed decisions.
And then also teaching them to fish at the same time. Finally, we’ll wrap it up with a call to action. So make sure that you have some clear steps to help really elevate your frontline teams and create those exceptional experiences. I promise you this is gonna be fast paced. It’s going to be practical and tactical.
Get out your phones, get your notes ready [00:02:00] ’cause we’re diving in. Now that we’ve covered the agenda, this is our first section here today, why frontline empowerment is so important and how it leads to better overall experiences.
Sandra Storey: And we’re gonna do some myth busting as we go through this. And before we get to our first myth, just a quick question.
How many of you at your organization have some vision around customer experience? That the customer is at the heart of everything we do. We’re customer centric at every level. Lots of hands, right? Okay. So here’s our first myth. Frontline workers trust that their organization equips them for success. And of course, we’re thinking of everything through our CX lens, so we’re gonna bust this one pretty quickly.
So 48% of frontline workers don’t believe that their organization does enough to provide excellent customer experiences. 50% of frontline workers are ready to quit in search of a better experience for themselves. 53% of frontline managers are burned out. That means [00:03:00] they’re not giving the support and the training and the coaching necessary for those frontline workers to thrive.
And 80% of desk-less frontline workers, right? So those that are out on the floor all day with customers, they don’t believe they get enough communications from their organization, right? They’re not sitting at the computer reading email. They’re out dealing with customers. So despite all these kind of sad metrics.
80% of senior leaders think that employee engagement is critical for business success and it is. So before we get into a bunch of client examples that we have on how to find insights, let’s just really briefly touch on employee engagement and what it means. And we’re gonna talk about the five aspects of employee experience.
Employee experience being all the way from when they apply for the job and interview that’s right to when they leave the company and maybe have a, a departure interview.
Kristi Nickl: Chris, so the five aspects of employee engagement. The first one, the work environment. Now this is gonna cover everything from the physical space, the [00:04:00] tools, and even the technology that they use to do their jobs well.
More importantly, it’s about creating that culture, right? That positive culture of trust where people really feel included. Informed and heard, right? They have to feel like their ideas are being taken into consideration. So work environment is that first step. The second piece of employee engagement is all about relationships because we know that strong workplace relationships help shape that employee experience and positive connections with coworkers and managers help create that sense of belonging, right?
That place where. People begin to be very motivated in their role and think about how when you have a really great customer experience story and you celebrate that, how it bonds your team and really solidifies that feeling of one team
Sandra Storey: and that goes right into company culture. Like we said, the, the customer’s at the heart of everything we [00:05:00] do.
Is that really your culture? Are you sharing feedback directly with the front lines? Because if we’re saying one thing and there’s a disconnect. Think about that when you’re trying to drive that company culture, training and development, that starts with all the onboarding training and all the development that goes on.
But from a CX perspective, think about allowing your team members to self-coach by getting that direct feedback. Shortly after the call or after the interaction, they can see the results and say, wait, I need to change this, or I need to keep doing this. Ultimately, all of that leads to job satisfaction and the way they feel about working for the company.
And again, think about how wonderful it would feel as an employee to be able to read the words of your customers directly when it happens to say, I delivered that experience to my customers and they’re thankful for it. So when we put all of this together, that’s when we build engagement. And the employee engagement is so critical because Christie.
Kristi Nickl: We know the big business impacts that it has. Things like employee [00:06:00] retention, so that positive employee experience can really increase loyalty and retention rates because we know that when employees feel valued and engaged. They’re more likely to stay with a company that helps reduce your turnover cost, and of course they’re more productive.
If a motivated employee is really doing their best work, they’re highly engaged, it’s gonna lead you to a much higher quality output and increased efficiency. And of course, employees who have that positive experience at work, they’re your brand advocates. They’re going out to social media.
They’re promoting their brand, they’re telling their friends they should come work for your brand, giving you that positive word of mouth all around. And then we know that customer satisfaction is really key because when employees are happy, they’re providing a better experience for your customers. And as a result, you’re gonna have better satisfaction scores.
So to recap. We have busted. Myth number [00:07:00] one. Busted. Done. Okay, so pay attention. We’ve got more myth to bust. All right. We know how important it is to share information with your employees. We’ve touched on that. We’re gonna share with you some practical frontline strategies, and these are going to be straight from the frontline with with some of the stories and examples we have today because we know.
That your associates, they’re engaging with your customers on the front line, and they see those pain points, they understand the opportunities, but you have to make sure that you’re listening to them.
Sandra Storey: So here’s one way that you can help. Listen now, this is a mock up. Thanks to chat GPT of a SharePoint site.
Many of us started with saying, okay, we need to hear from our employees. They have ideas, they have ways that we can fix customer experiences. Let’s let them tell us, and we do a SharePoint site. I know I did one of these. Many of you probably have, now, this is an example. This is a telecommunications company, a North America telecommunications company, [00:08:00] so they have frontline employees.
On the phone in their retail centers. They had 600 users and they were pleased. They said, okay, people are starting to engage and are giving us some ideas, but they realized they needed to do something at scale. So they implemented Medallia ideas and that’s our crowdsourcing platform where you can have them contribute ideas, you can push out some ideas and have them voted up and down different things.
18,000 users began engaging with the platform. And I, while I think some of the number of ideas that were generated, I think that’s amazing. My favorite metric is the last one where 600 knowledge gaps were identified. Your frontline people are out there in front of customers and they’re being asked questions and they’re saying, no, we can’t do that.
No, there’s not a way. Maybe there is, and they just don’t know it. So by identifying those knowledge gaps, we’re not only improving the employee experience, but the customer experience as well. Now that’s a general idea of how you can use Medallia ideas. Kristi, you have a really specific example.[00:09:00]
Kristi Nickl: Yeah. Thanks, Sandra. So here’s an example from a national Quick Service restaurant brand. They wanted to figure out was there an ingredient missing from their order. Or was it missing the order of french fries because the DoorDash driver ate them. Come on. And through Medallia ideas, one GM had made a suggestion, can we put a photo at somewhere in the feedback?
Can we collect a picture of the order so that we can understand the condition that the order arrived in? And. We include this on the final page of the survey, so it’s tied directly to the customer feedback. This helps them understand if there was an item that was forgotten or forgotten to remove, like the onions on the burger or if it was just haphazardly put together.
So this really serves as a great coaching opportunity for this particular brand. But what do you think is that photo helpful? Kinda telling what happened [00:10:00] within the experience, right? It not only shows what was wrong, but how it was actually presented to the customer. So I think that’s a great photo and a great first step.
But the next thing that they implemented, and you can see in this second picture. Good picture, right? It’s pretty helpful in telling you what went wrong, but the other idea that they had brought to us was how do we better understand accuracy of order? If you’re in the restaurant industry, you know that is such an ambiguous metric.
It’s tough to decipher. So we expanded text analytics into a second tier. We broke it out by were ingredients missing, was it incorrectly prepared? Was it cooked into correctly? And now we can actually begin to understand root cause and where those pain points are. So finally these two changes combined together really had an impact on this particular client.
It drove [00:11:00] accuracy up 12%. NPS had a significant impact as well. The employee engagement went through the roof, so they were able to understand that this drove engagement up by 33 points using their health check reporting, right? To see a pre-post comparison. And it just goes to show you how a really small insight can lead to a big impact.
Pictures and diving into TA topics. Into a little bit further process
Sandra Storey: And those employees felt heard, right? Absolutely. They’re like, okay, you’re actually listening to us. You’re taking our ideas and putting them into action, and we see the results. Okay. Our next myth call monitoring or qa, it hasn’t changed much over the years.
Now, unfortunately that may be true for many, but let’s talk about an example that we have from a large North American retail bank. And again, when we talk about, I work in financial services, Christie works most in food and hospitality and retail. Imagine this for your [00:12:00] own scenario, your own vertical. This particular organization, they have about a million calls annually and they were doing the three QA calls per month and the, normal arguing about the calibrations, and that’s their process.
They, I implemented Medallia speech. You heard about that a little bit in the keynote. They were able to then monitor a hundred percent of calls and dive in just to the section of the call that was problematic or aggregate it and look at different themes. By doing that, they increased their first call resolution in a three year period by 8.7%.
Now, many of us stop there and we’re like, woo hoo, first call resolution way up. We’re good. Don’t stop there. All of us are being asked to prove our ROI, right? You’re constantly being asked from the business what’s the bang for the buck here? What they calculated that they have an 11 to $12 cost per call.
It was over a million dollars in cost savings. And when you give that to an executive, you can just say, you’re welcome. There’s your million dollars, right? I’ll keep doing some more stuff [00:13:00] for you like this. So that myth is busted, that QA hasn’t changed. The question is, are you on that bandwagon or not?
So that’s a question for you to answer. Okay. Another myth number three. Dashboards for the front lines should always start with NPS, right? That’s our North Star should always start there. Christie what? Say you,
Kristi Nickl: right? So how many of you out there are starting your frontline reports with NPS?
You know what happens? What you focus on has a tendency to be what everyone else focuses on as well. So most brands lead their reports with NPS, but how does a frontline associate really drive NPS or oat? If it’s the first thing they see, that’s exactly what they’re gonna focus on. Why not instead.
Pick a couple of your top drivers. Put that at the top of your reports. Now, every time they go into the reporting, they can see where they can actually have an impact. It’s not just about a big picture metric like NPS. That’s [00:14:00] great for leaders, but we’re trying to get action items built here. The additional thing.
Is that once we can drill into an item like speed of service, this is some new reporting views that we have been creating recently. They’ve been getting some great reviews from clients in their, how they’re using this information. You can click into speed of service and we’re gonna have a slider drawer that opens and actually drills into speed of service opportunities further.
In one click. We now note that delivery for this brand is their biggest opportunity, and it’s having the biggest negative impact on the customer’s experience. So one click insights is what our goal is here. I just wanna do a little commercial plug. Tomorrow at two 15 there’s a text Analytics 2 0 1, and it’s led by Rachel Ricketts.
She’s gonna walk through this report in more detail. But again, one click [00:15:00] insights not focused on NPS focused on speed. Here’s an example of a report that I added to a national quick service restaurant brand that I work with. This is what we call a time of day of week heat map. Now, in looking at this, you can immediately see where the opportunities are.
A manager can take this in the restaurant, bump this up against. Their labor model and begin to see where those opportunity shifts are. For example, you may see a Monday at dinner, Ooh, double zeros. That’s rough. But the sample size is 22, and many of you will react to that and say, don’t worry about that.
Sandra’s gonna tell us why we shouldn’t dismiss that here in a few minutes. Also the additional opportunities here are Friday and Saturday nights for this particular restaurant concept. And this brand that I work with uses this [00:16:00] information to determine when it’s time for their to roll their delivery orders over to DoorDash.
So while this is a small insight for a franchise brand, it can mean the difference of a successful in-house experience. Or a really poor delivery experience. So myth number three, dashboards for the front lines should always start with NPS, and that myth is busted.
Sandra Storey: And on the operational piece, just a quick show of hands, how many of you are integrating operational data with your CX metric?
There’s a few hands. Yeah. That’s what makes this possible, right? To be able to see what’s happening when, whether it’s the speed of the call or the time of day, whatever the metric is, so absolutely critical to find these insights. Okay. Here’s another, this is one of my favorite myths.
My sample size is too low for the data to be actionable. Just can’t do anything with it. Now we’ve built [00:17:00] on our dashboards, small sample size indicators for that very reason, so that you can look at a dashboard and say, is this worthy of my attention or not? You might have that set for under 25 for organizational reporting.
You might have it at 50, 75, a hundred. You get to set that. And while that makes sense that you don’t wanna make organizational changes for a couple of comments, we’re talking about front lines today, aren’t we? I would propose that for front lines you use less than five. And I’m gonna give you an example why this is a Ranker report.
One of my favorites when we’re trying to find what is the story behind the data. So here we have and this is, the names are made up of course, but it’s a real report from one of our clients and it’s a large North American insurer. And it’s B2B and these folks that, that are being ranked, they’re being ranked on net promoter score and the ease of process in a risk assessment their analysts working with the B2B clients.
If you are a regional manager, you might look at this and say, eh, it’s all small sample size. There’s [00:18:00] nothing to do here. If you’re an employee, you might say, eh, I get that little red half circle. I don’t need to look at it yet. I’ll look at it when I get enough sample. But let’s look at two of the people on here, James, towards the top.
He has eight surveys. Perfect. 100 in both of his metrics. He’s doing something right. Others could probably learn from him. He’s found some solutions to some challenges, and he’s overcoming them. He’s on fire. Let’s capture that. Meanwhile, poor little Emma down here, she has five surveys and she’s at a 40 now, if she wants to do well in her job, which we lead with the assumption that most of our frontline team members do.
She’s not happy. Now she doesn’t know how to do well. That’s a whole different conversation. But we’re going with, she wants to do well. She’s seeing this and she’s getting discouraged. When are we gonna start helping her when she gets to 25? Bad surveys. No one bad survey. Two bad surveys. Could be a fluke.
Customer had a bad day, employee had a bad day. One or two is a fluke. Five is a pattern. Start coaching. Start having your managers [00:19:00] take this seriously and they don’t, with those red half circles. So think about that. Oh, so busting that myth. Sample size is too small. It’s not, take some action.
Kristi Nickl: All right, so we’ve talked about some practical frontline strategies and what teams can offer up, but how do you coach someone to use Medallia reporting to find the insights on their own and to do a little bit of phishing?
So we’ve got some examples here today. We’re gonna teach you how to find those insights on their own, or how to teach you to teach your front line. So everyone loves the idea of a silver bullet, right? We want that magical million dollar idea, but silver bullets really only exist in fairytales. If you’ve got a wolf you wanna take down silver bullet is the tool for you.
But most bullets are made out of everyday common metals, just like insights. So please, they don’t have to be flashy, they don’t have to be magical. They can just be everyday [00:20:00] common insights as long as they lead to impactful change. So I wanna ask you a question. How many of you are sharing your top drivers or your key drivers of your program and your business out with your field?
Hands? Good. Now leave ’em up. If you’re also sharing what to do with those drivers. Nice. I’m encouraged by this, Sandra. I’m encouraged. It’s very good news. All right, so that’s often one of the challenges that we get into, right? If you had to put your arm down, don’t worry about that. We’re gonna give you some tips today on how to dive into that, and I think Sandra has a really good world.
Example of how we would do that, start wide and dive in.
Sandra Storey: And it was interesting as we were preparing this presentation, we, we had those previous examples of just frontline reporting and those directly to the frontline employees and their managers. But then we said, okay, when we are asked to go in and find stories for the CX or the VOC team to share, how do we [00:21:00] go about doing that?
And we both wrote it down separately and we compared and we’re like, okay, yeah, we’re doing the same thing. So let’s show those things. So here’s one of them. This is one of my favorites. So this is a North American high-end insurance client. Very high touch. They’re not the cheapest but white glove service.
That’s what they pride themselves on. Their numbers were just flat, stagnant, and they’re like, okay, we’ve been doing this for a year. We look at our NPS, we don’t really see much going on. What story can we tell the front lines? What can we do? So we’re like, all right, let’s dive in.
I like to go into the key driver review, right on your data analytics tab. And look at which key driver is either lowest, consistently or has taken a dip lately or has something going on and keep well-informed was significantly lower than the others. Remember I said this is a high touch high-end, expensive insurance firm.
Keep well-informed is the lowest one. Okay, so then the next favorite thing I like to do, because [00:22:00] that top line number, it’s muddy, it’s murky, dig into the hierarchies. You’re gonna see differences. And that’s what we did here. One group was 12% lower than the peers in claims handling teams. Why are they so much lower?
We also then went to the TA impact score, and we found that communication and follow up was the top topic for a negative impact score. They were losing six points there. The rest of the teams were just losing three. They were able to bring this back to the front line and say, let’s focus in on this group.
They had SLAs, of course, a company like that is gonna have SLAs for their claims handlers. They weren’t being adhered to, and the manager wasn’t coaching them. Okay, let’s fix that, right? We, we shouldn’t have customers saying I had to call five times, or it took three weeks. So by just digging in and finding the story to bring back to the front line, don’t make them find it on their own.
Show them how to do it. Show them that technique and the funnel often works. Yeah, that’s a great
Kristi Nickl: example. Here’s another one. This is from the [00:23:00] retail world. This happens to be a very high-end luxury retailer, and they’re pulling in their operational data into the Medallia reporting. So if you’re doing that, kudos.
If you haven’t yet, here’s another opportunity. This is an example where customers were not offered assistance in a welcoming way. Many of you likely have this type of question in your survey, were you greeted, were you assisted, were you welcomed, were you thanked? All of those kind of operational metrics that you’re holding your teams accountable too.
So this brand found that when customers were left to navigate the store on their own, they only spent about $109, right? They were able to do this through that data integration, and what they also found with the, when they were offering the assistance, it helped increase those transactions to $125. So taking them to the item, assisting them, helping them understand, [00:24:00] and by adding this data to the reporting website.
Now they can see this every time they log into the system, and the frontline manager is reminded how valuable their employee engagement with their customers is. This is not a one-time insight that lives in a deck on an executive’s desk somewhere. It’s front and center every day in reporting, reminding everyone how important this step is.
Sandra Storey: And those folks are on commission, right? Yeah. They should be wanting to sell more. So here we’re gonna back that up for you and show you I love that one. Yeah.
Kristi Nickl: Commission.
Sandra Storey: Bottom
Kristi Nickl: line sales for the company. Everything goes up. NPS. Yeah. Yeah.
Sandra Storey: I love that example. Okay, so here’s one. We’re gonna do a little bit of an eye test if any of you have been to the eye doctor lately, so get ready for that.
If you need to put your glasses on, do so this was an organization that came and said, okay, we’ve been doing this for a year. We have a dozen or so programs. What are some insights that you’re seeing? We [00:25:00] want fresh eyes. Give us some insights. So they had over a dozen programs and about half were up and half were down.
That was the first surprising thing. I’m like you shouldn’t really have half your programs down. What are you doing? So the one that was worst was the home equity, right? That’s a pretty big significant transaction for a client. We wanna make sure that’s a good experience. So everyone was down collectively at eight points.
That’s a big drop year over year in your NPS. People should, alarm bells should have been going off. I started doing that split out by the hierarchies, and one region was 24 points lower than the others. But I said that’s not really the story. The fact that they’re down eight, that’s the story. So it went into the reporting and here’s your eye doctor example.
So the first one is option one. This is how the report looked. Now many of you have this trend line report. It can be very helpful. In this particular example, the home equity team, the line of business was going in. It was like, eh, [00:26:00] it’s all over. I don’t really see a story. You can see the numbers if you look really carefully, negative 2.9 to last year, negative 3.68, but it didn’t scream out at them.
And this report, I’m sure you know this, it’s dynamic, so it’ll set its range based on how much of a gap you have. If you have a 15 point gap, the range will be 20. This is a 50 point gap. That alone, I don’t think I’d ever seen this at a 50 point gap. I’m like, that’s alarming. So I’m gonna give you option two.
And up in the upper right, all the different views for your report. Don’t get caught up in, we always have to have the same report. You find the story that you want your front lines to see, and you show them that story. Here’s an alternate view. Same report I just clicked. One of those alternate views that zero in the red.
I put that in so you could easily see. Everything to the left are attributes that are down, speed of funding, application, process, convenience of closing. And the ones to the right are the positives. I have to believe if the home equity line of business had [00:27:00] seen this, they would’ve said, oh my gosh, what are we doing?
We’re closing faster, but everything else is worse. And ironically, the worst one is speed of funding. Once you close, so again, I ask you eye test, which one is better to tell that story? One or two. Two. Thank you. So don’t keep your report static. And this wasn’t, we have to go and have PS hours.
We just change it. Just change the default.
Kristi Nickl: Yeah. We know also, we talked about earlier how listening to employees is really gonna give you some valuable insights, especially into your store operations. Here’s an example of when global. High-end retailer who had this hypothesis that limited product skews were inhibiting sales in the store.
So we also know that, if they’re not engaging with teams right then they’re likely missing the boat. But this gives us the opportunity to collect the [00:28:00] feedback from that frontline associate. We put a QR code up in the back room, and then we asked a very short two question survey. What’s inhibiting your sales?
Again, the hypothesis was that they weren’t getting the right product in stock. I’m sure those retailers in the room have heard that before, but really she needed data to take to the product team, and when we ran this pilot, we found that 40% of responses showed that customers were just browsing. Okay, this is a high-end retail brand that has a clientelling relationship with their customer.
What was happening, they were just browsing. She quickly realized that they needed to go back, train in some specific regions that were struggling in sales and get very tactical around refreshing how to qualify your buyer, how to establish a need, how to solution a product for them. [00:29:00] So it’s not the feedback we expected, it’s not the results that we thought we were going to get.
But wow, did that insight have a big impact on their business? You bet. It eliminated that excuse, right? Just browsing, not exactly the outcome we expected, but it was a great insight nonetheless. Sandra, do you have another
Sandra Storey: example of this, and speaking of excuses? Oh, my NPS is low because my customers are too.
Fill in the blank. They’re too old, they’re too young, they’re too rich, they’re too poor, they’re too urban, too rural. In my time leading CX programs, I heard every single example that you could have out there. So this is a myth that we’re gonna bust pretty quickly. Here’s an example. Again, this is a retail bank, a large regional bank.
They had, we’ll call him Adam, we’ll call her Betty. Adam was in this one branch for years, always the lowest in the district in NPS always. But it was because he told everyone and they bought in. It [00:30:00] was a business branch, right? It was a high end retail area, mall, outbuildings and all that. They were runners, they were doing business deposits.
There were always lines, very fast paced. How can you possibly do NPS there? That’s what they used to say. We can’t do NPS here. Meanwhile, Betty was a couple miles down the street with a high end clientele, very white glove. It was slow, not a lot of transactions. They could give them all the attention they need.
So obviously they have great NPS, right? The district manager bought into those stories of why the results were what they were, and the region manager said, no. You know what? Let’s do this. Let’s flip Adam and Betty. And they did that and within six months, the scores followed. The manager oh.
It wasn’t the business customers, it was Adam, it was how he was leading his team, the example that he was setting. And you can find this on the top five, bottom five report, right? If you show those to your regional managers and your directors. Let them see are, is it always the top people and is it always the bottom people look in to see, and when they [00:31:00] start to give that excuse, we’ve busted that it’s not and you can likely find an example of this in your own data.
Have it handy. So when they start giving the excuses. Okay. Another myth, issuing a refund, Christie, is the most effective way to resolve a customer issue. Sounds
Kristi Nickl: logical, right? This is one that even surprised me. I was really shocked by this one. So here we have a restaurant client. So this is a, an international quick service restaurant.
Making sure for the non-restaurant folks, I get the acronym explained correctly and what they were able to find. Was through their case management form. So let me ask a question real quick, closed loop feedback process. Who has a case management form that says, what actions did you take to correct the customer’s issue?
Great. ’cause it’s a best practice. What I did not expect, however, is that when the Nsat team ran this analysis, which if you didn’t know they could, they absolutely [00:32:00] can. They tried to understand the value of the service recovery steps taken. Everyone starts with the apology. That’s great, but is there more to it?
And in this example, in the 90 days. Post their negative experience when they were followed up with, they spent on average $35 and that’s, oh, sorry. They were offered a refund. I forgot that critical piece. So offering a refund, it seems logical. Just give ’em their money back, we’ll take care of this.
However, when you actually took the step of offering to remake that order, their satisfaction increased. Their spend increased to nearly $39. And for one brand that is highly franchised, this made a lot of sense because hungry families are still hungry when you offer ’em a refund. But when you offer to remake that product [00:33:00] and deliver it to them.
Now you’ve solved the problem, you’ve saved the customer, and you’ve fed their immediate need, right? No pun intended. So small insight, but to a franchisee, especially an individual small operator, it’s a small change or a small insight that can have a really big impact. So myth number six. Issuing a refund is always the most effective way to resolve a kit, a customer issue.
That myth has been busted,
Sandra Storey: and so talking about we call them M ssat, our Medallia strategy and analytics team. Super brilliant people if you need to, dive deep in and really get the analysis done, there’s a lighter version of that. That’s the version that Christine and I can do, and that’s called an Actionable Insights Workshop where we work with.
Our clients to find insights to show people how to fish. So this is on that same vein. This is what action are we taking with customers? [00:34:00] So it, this is a B2B financial services firm, global, large global firm. And we were looking at their closed loop and they said, they actually came and said, can you help me get better reporting for closed loop?
I can’t tell you how many time I’ve had that question. Can we get better reporting? Absolutely we can, but let’s go back to the beginning and see what’s happening. So that’s what we did here. 54% of the time, the alert owner was saying they apologize for poor service and advise clients of the next step to be taken.
Now, first of all of you experts on surveys, that’s a double barrelled response. So if they say yes or no, which one were they doing? Were they doing both? So that was problem number one. More than half the time, that’s what they’re doing. 86% of the time, the only communication that we saw evidence of was the rapid response form going out.
Now with smart response, hopefully you’ll all get that enabled. That will be even better, but that’s outbound only 6%. You can actually track this. You have to [00:35:00] add some filters, but you can track this. Only 6% of clients responded, so there’s very little two-way communication. So imagine my surprise when I saw that 94% of the cases were solved.
So we have to think about what we’re actually asking and what we’re capturing. So in this case, let’s back up and let’s go to what are you trying to achieve with your case management form, with your alert process? Okay. When you know what you’re trying to achieve, then we have to think about the behaviors we want.
I would argue in closed loop feedback. You want two-way communication, okay? Then in the case management form, we can ask about that. Did you have a two-way conversation with a customer via email or phone? Then you ask, did you solve the problem? So you don’t get numbers like this because this data was useless.
It’s useless data. So that’s our actionable insights that we can do. And I can’t believe we’re actually on time. This is amazing ’cause we like to talk. So this is good news for all of us. All right. Our
Kristi Nickl: time does go really quickly, but it does. We’re also fast talkers Sandra and I have shared with you some of the [00:36:00] frontline empowerment, why it’s important, how to take some steps, how to teach them to fish on some of these insights on their own.
Now, here’s your call to action. We have a big summary here of what we’ve covered here today. So take out your phones. You’re gonna be on an airplane in two days and you’re gonna be like, what did I learn on Tuesday? This is gonna help refresh your memory. So again, these are all of the points that we covered today with or without myths, but we’ve got some great tools and some very specific products that we think can help you not only be exceptional in your business, but take some of those small insights that can really have a big impact.
Some of the things you can do as far as next steps to find out about these in more detail. Obviously talk to your account teams. They’re always happy to have further conversations around how to refine reporting, how we can bring in folks like the M SAT team to do an analysis, folks like Sandra and I to help advise on some of these items.[00:37:00]
So don’t walk away from the session feeling empty handed. Take one of these action items and let’s talk about how to move forward on some of them together. And as a reminder, we still have some meet the expert sessions open, so you can always talk to an expert in more detail. I’ve been told we have about four minutes for questions.
Q+A: When you showed the combination of the operational data with NPS, is that coming from like where you could see the difference in the types of experiences? Was that coming from. The verbatims in or the service drive? Like how do you get that information tied to it?
Kristi Nickl: That information typically comes over and Sandra, it may be different in finance.
But that DA data typically comes over on the invite files. So we get key items like spend with restaurant clients. We get tips. So we can understand, did their tip actually follow how they were evaluating the experience? ’cause gosh, as a server, that’s powerful. But most brands, yes, are sending that on the invitation file.
Some folks may send a a follow up file to connect that [00:38:00] data maybe a 24 hour, 48 period later to append it, to be able to update it. So there’s a couple of different ways you could tackle it. I preferred on the invite file ’cause then you can begin to trigger survey questions off some of those elements of the experience as well.
Did that answer your question? Yes. Okay.
Sandra Storey: And just any operational data that you have that you can include in the file, we can help do cross references for, whether in the contact center, if it’s hold time, number of transfers length of the call. Just anything that’s out there, if you can get it from your operational folks or your business lines.
We can integrate it and we can figure out a way to cross reference hospitality.
Kristi Nickl: That room data, that number of the room and what floor they were on, that’s gold as you’re trying to tackle issues within the room or maintenance or housekeeping. So that’s one example of how we might pull it in for another industry.
Great question.
So the question was, if you didn’t hear it, if your frontline employees don’t have email addresses, they’re not [00:39:00] engaging with them that way, what are some of the best ways you can communicate? My, my instant reaction is if they have access to the frontline reporting, I. You C we have a lot of different methods that we can communicate with them on the dashboards.
If not, I might challenge you. Why not? Why aren’t you giving them access to the data? But one of the tips that, that I always, when I go through implementation with clients is I encourage them to put a banner section on the landing page of their reporting. So when they come in, any type of action, speed of service, delivery, Friday, Saturday night, that’s our opportunity.
Go check where. Were your performances compared to the brand? That would be a message I would post on the front of that banner. So the first thing they see is, what does my brand want me to focus on? What kind of learnings are they giving me to go help solve this problem? So that’s one example of how I would do communication.
Sandra Storey: And I would say the [00:40:00] other one is to make sure that your frontline leaders are equipped with a toolbox. And that may look different depending on your industry. It might be, the old fashioned meeting in a box. You give them resources to hand out in those meetings, having a huddle every morning, it’s, it’s something that we’ve been doing for years and years.
There’s a reason that we do it. Communicate what’s important, what’s going on. And I would say this, if we as CX leaders try to get our organization to do CX. That means you’re doing something else. And you know what? I have all these other responsibilities. How can I possibly do cx? I’m, this is important.
This is what my boss is asking me about. Don’t ask them to do cx. Find ways to integrate CX into everything else they do. It shouldn’t be something else. It should be how we do things. I even think, in a banking example, what we’re doing sales coaching. Don’t just coach on sales. Talk about when you said this, I saw the customer experience [00:41:00] happening and it was this, when you’re doing an operational safe deposit box, there’s a customer impact.
If you drill a box that has contents in it, I’ve been there, it’s really awful. Oh my gosh, here’s someone’s stuff. Now do we do, there’s a customer impact to everything happening in a casino, in a restaurant, in whatever, in government, whatever your industry is. Try to find ways to integrate it so it’s not something else.
Kristi Nickl: Okay. We are at time.
Sandra Storey: We are. So there are two things lemme do. I’ll do the first one you do, the second one. The first one is in real time they made these cute little table tents for you. So feel free, scan it, give us some feedback. We love to hear what went well, what didn’t, how you felt about our session.
Kristi Nickl: Because we’re committed to doing this every year, we love doing this. We are passionate about the frontline. If you haven’t figured it out. Very much probably from being frontline operators for too many years, but we are gonna head back to the main stage will ga. If you haven’t read his book, I highly recommend it.
It’s an easy [00:42:00] read, and even if you’re not in hospitality, you’re gonna find some great tips and insights in this. So go see him. If you’ve seen the bear, you’re gonna enjoy this next session with Will. He’s fantastic and thank you from Sandra and I both.
Sandra Storey: Thank you everybody.